John Atkinson has measured many ESL's for Stereophile and notes a "hashy" waterfall response.
This looks to affect the highs. I cant say Ive heard it. Does it matter?
Would it be beneficial to cross over to a tweeter/planar/ribbon so the panels are unloaded in the hashy zone
and also to save the amp driving into the low impedance zone.


Modelling of resonating wave modes:

This looks to affect the highs. I cant say Ive heard it. Does it matter?
Would it be beneficial to cross over to a tweeter/planar/ribbon so the panels are unloaded in the hashy zone
and also to save the amp driving into the low impedance zone.
Modelling of resonating wave modes:
Attachments
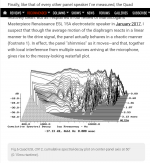

I'm very surprised to see that fast drop in high frequencies from what looks like 14 kHz and irregular behaviour from 10 kHz or even 5 kHz
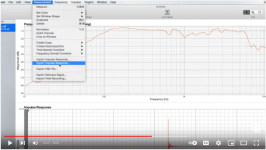
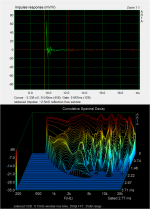
I can't produce a CSD you present it, but here are my REW Quad 989 measurements in some graphs. All measurements are done up to 24 kHz on axis @ 1 meter
Waterfall, spectrogram, decay in 20 ms steps, frequency response with 1/6 and 1/48 smoothing.


I can't produce a CSD you present it, but here are my REW Quad 989 measurements in some graphs. All measurements are done up to 24 kHz on axis @ 1 meter
Waterfall, spectrogram, decay in 20 ms steps, frequency response with 1/6 and 1/48 smoothing.
Last edited:
As I written many times on this forum, "Those guys aren't qualified to pet my dog".
That 0ms calculation in the 2912 graph doesn't even look right, something is wrong, like he is off axis or something. Where is the energy stored in the speaker, especially at high frequencies? I suspect we are looking at a misbehaving amp driving the reactive loads of those speakers.
Keep in mind that these are my QA measurements, not an attempt to get a perfect measurement of the speaker response.
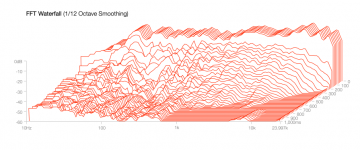
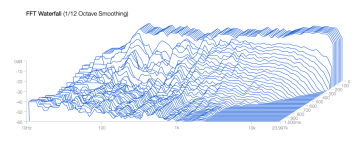
Here's some measurements, 10mS steps, Half hanning window, 32k fft length, 1/12 octave smoothing. Microphone 1m away on speaker axis
I'll start with the 2912 so to match their plot:
(it appears that my mic is a bit off-axis below the acoustical axis of the speaker. My mic stand is for drums and it doesn't get quite high enough for the angled back panel geometry of the 2912. Since it's for QA of my rebuilds, it's not crtical)

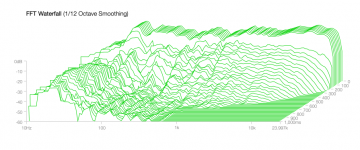
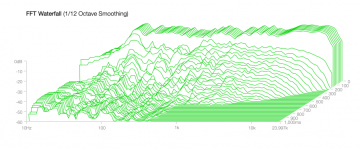
Here's a 989, which is going to look a lot like the 2912, because they are the same inside:

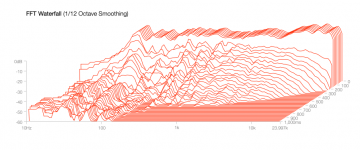
Here's a 2805, also the same inside minus the two extra panels:

Here's a 988, same guts:

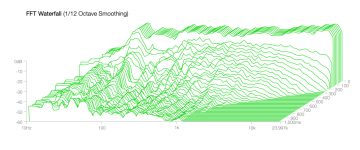
Here's a 63:

Even the original ESL, which is about as simple a design as one can imagine doesn't have stored energy issues in the top octaves:

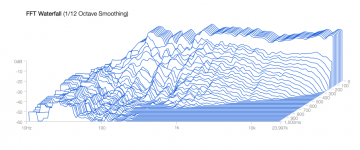
And in case you think I'm cheating with smoothing, here's a much less smoothed measurement:

Sheldon
That 0ms calculation in the 2912 graph doesn't even look right, something is wrong, like he is off axis or something. Where is the energy stored in the speaker, especially at high frequencies? I suspect we are looking at a misbehaving amp driving the reactive loads of those speakers.
Keep in mind that these are my QA measurements, not an attempt to get a perfect measurement of the speaker response.
Here's some measurements, 10mS steps, Half hanning window, 32k fft length, 1/12 octave smoothing. Microphone 1m away on speaker axis
I'll start with the 2912 so to match their plot:
(it appears that my mic is a bit off-axis below the acoustical axis of the speaker. My mic stand is for drums and it doesn't get quite high enough for the angled back panel geometry of the 2912. Since it's for QA of my rebuilds, it's not crtical)
Here's a 989, which is going to look a lot like the 2912, because they are the same inside:
Here's a 2805, also the same inside minus the two extra panels:
Here's a 988, same guts:
Here's a 63:
Even the original ESL, which is about as simple a design as one can imagine doesn't have stored energy issues in the top octaves:
And in case you think I'm cheating with smoothing, here's a much less smoothed measurement:
Sheldon
Attachments
Can you format your 2912 plot to more closely match theirs on the time and dB axes? Their plot is only roughly 4 milliseconds long and about half the decibel range of yours. I'm not saying their format is more useful, just that they are scaled very differently, so harder to compare.
here's a 4ms window, and a 24db amplitude scale. I'll have to sample a lot higher to get more detail
Sheldon

Sheldon
Thanks.
From what's there, your data does look calmer in the top octave compared to Stereophile's.
From what's there, your data does look calmer in the top octave compared to Stereophile's.
It looks like you may have a reflection corrupting the CSD, and the range should be extended 12dB to match.here's a 4ms window, and a 24db amplitude scale. I'll have to sample a lot higher to get more detail
Sheldon
View attachment 1022772
What software are you using? Are there filters available other than the Half Hanning? this will wash out the impulse decay.
Any chance you can post the raw impulse data as a *.wav or just ASCII *.txt file? I should be able to match up CSD settings with Stereophile using ARTA.
If you are able to post the impulse files, I would also be interested in seeing one for the 988 which presumably you could place mike on axis unlike the 2915.
To compare two CSD plots you really need to be using the same settings for FFT size, shift size, apodizing filter rise time, and dB range.
For those unfamiliar, I had posted some trend plots illustrating how the different settings affect the CSD plot.
https://www.diyaudio.com/community/...ng-a-popper-csd-waterfall.345255/post-5995041
https://www.diyaudio.com/community/...ng-a-popper-csd-waterfall.345255/post-5983208
Just noticed the order of attachments got shuffled a bit in those posts during the migration to new platform. 🙁
Hopefully the notes will still be decipherable. I'll have to ask an admin about correcting the shuffled order.
Oh! one other question. When you took your measurements, were the dust covers and grills in place?
I think it can matter if it is bad enough.John Atkinson has measured many ESL's for Stereophile and notes a "hashy" waterfall response.
This looks to affect the highs. I cant say Ive heard it. Does it matter?
My recollection from looking into this previously was that:
- curved panels like Martin Logan that have high tension top to bottom, but low tension side to side had extremely hashy CSD plots.
- unobstructed flat panels with uniform tensions had very clean CSD plots.
- flat panels with dust covers, perforated metal grills, or thick felt damping pads spaced away from the diaphragm have clean CSD plots that are marred by one or more decay frequencies from the reflections between the various spaced components.
Eureka! Thanks.unobstructed flat panels with uniform tensions had very clean CSD plots.
https://www.diyaudio.com/community/threads/superb-article-on-hf-esl-phenomena-imho.321111/
Innersound electrostatic by Sanders
That doesn't surprise me at all. My measurements are entirely for me to check the workmanship and any hidden issues with my rebuilds. I know exactly what the response should look like when I measure in the same location in my shop. I find that windowing my data obstructs what is going on the bass area, which I use to check resonant points, and the input filter operation. So while these measurements are great for my immediate needs, they are not ideal measurements for searching for other design issues.It looks like you may have a reflection corrupting the CSD, and the range should be extended 12dB to match.
These files are legacy measurements from many rebuilds over the years. I don't have a set of 989's here at the moment, so I can't get more measurements from that model. I can haul my 2912's back into the shop and make measurements if that would be useful. I can put my mic on a box to get it higher.
I have three pieces of software that I use for various measurements. For the plots above, I use a package called Fuzzmeasure with a Focusrite Scarlett interface and a behranger measurement mic. Fuzzmeasure uses a swept sine technique rather than MLS for the excitation. I use the same measurement hardware with LabView code I wrote in the early 2000's occasionally. I do impedance measurements with that code. I've been poking around with swept sines in python lately as well, so I can write something specific as well if needed.
I'll be glad to make measurements as needed if anyone would like them, just describe the measurement and I'll make it.
Sheldon
You should be able to export the impulse response for your legacy measurements in Fuzzmeasure as *.aif files, which are easily converted to *.wav files for manipulation in ARTA or REW. I think the legacy measurements you have should be fine if there is at least a 3.5mS reflection free window. You might try posting one for evaluation before bothering to drag your 2912 back to the shop.
Attachments
Thanks!
Attached is a view of the first 10 milliseconds of the impulse response and the resulting CSD with settings to match Stereophile methods as best I can. You can see a first reflection at about 2.5mS after the impulse arrival and than another about 2mS after that. To avoid corrupting the CSD, you have to set the end of the analysis window just before the first reflection. The CSD would even better detail and extend lower in frequency if we had 3.5 - 4mS of reflection free window.
An alternate way to look at this first 10 milliseconds is with REWs wavelet analysis. Using wavelets, you throw away some time resolution and some frequency resolution to gain a bit of insight as to how the frequency response changes over time. It makes the reflections at 2.5mS and 4.5mS easy to see, and the resonances decaying in the top octaves are still discernible...but not with as high a resolution as with the CSD.
Attachments
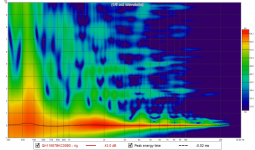

That wavelet graph I can reproduce.
Here is an OUTDOOR measurement of an ESL-63, so there can be no reflections.
The measurement was taken in the middle of the fresh mowed lawn on a very early Sunday morning during first Covid lock down when there was no traffic and no wind.
Now the the million dollar question is, what is a good interpretation of what I'm looking at.
Two items stick out to me in your spectrogram.
1) There looks to be a reflection about 4mS after Impulse arrival. You should be able to look at the time history of the impulse response and see the reflection.
My guess this is a ground reflection. Do you recall how high above the ground you had the ESL63 placed? and what the mic distance was?
2) These appear to me to be visibility of the reflections between the dust covers and diaphragm...the cause of the resonances seen in the CSDs You might determine their times and back out the distance traveled by sound waves during that time. My guess is it will match with multiples of the round trip distance between diaphragm and dustcovers.
This is fascinating. I should still have the measurements I took in 2015 when I experimented with dust covers.
I will dig them up and see if spectrogram shows similar reflections appear in the top octaves when the dustcovers were added.
https://www.diyaudio.com/community/threads/all-acoustat-panels-can-give.282031/post-4551994
You might also try changing the wavelet frequency resolution.
- Lowering to something like 1/3oct should make the reflections more prominent.
- Increasing to 1/12oct should make the resonance decay with time more obvious.
Attachments
Nice pictures!
Speed of sound = 330 m/s, ==> so 3 ms reflection corresponds to 1 m additional path length. 4 ms suggests about a 1.3 m reflection, so its not the dust covers.
Can you recall the measurement setup?
Speed of sound = 330 m/s, ==> so 3 ms reflection corresponds to 1 m additional path length. 4 ms suggests about a 1.3 m reflection, so its not the dust covers.
Can you recall the measurement setup?
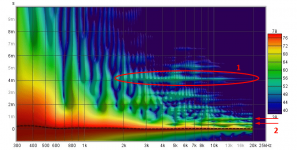
The reflections I was suggesting might be caused by the dust covers are labeled "2" in the spectrogram and are < 1mS.
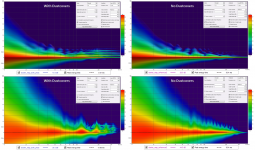
Attached are the spectrograms of the measurements from my 2015 dustcover test.
- left side is with dustcovers, right side without
- top is 1/3 oct wavelets (more time resolution), bottom is 1/12 oct wavelets (more frequency resolution)
The HF reflections seen in the upper-left plot are 0.156mS, 0.309mS, 0.477mS, 0.630mS, and 0.783mS after the primary impulse arrival.
These are all multiples of roughly 54mm which is nearly exactly twice the spacing of the dustcovers from diaphragm in my test.
Attachments
The setupNice pictures!
Speed of sound = 330 m/s, ==> so 3 ms reflection corresponds to 1 m additional path length. 4 ms suggests about a 1.3 m reflection, so its not the dust covers.
Can you recall the measurement setup?
ESL 63 on the stand and deliver lab stands, so 25 cm from the ground, with dust covers, grill and cloth in place.
Nearest building more than 20 meters
Mic minidsp UMIK-1 on free mic stand with hinge
Mic at 1 meter on axis in center of rings.
Measurement sound level set at 75 dB 1 khz as advised with REW.
The amp a Quad 520F and laptop was on a chair about 2 meters from the speaker placed on the side.
Last edited:
The outdoor measurementsTwo items stick out to me in your spectrogram.
1) There looks to be a reflection about 4mS after Impulse arrival. You should be able to look at the time history of the impulse response and see the reflection.
My guess this is a ground reflection. Do you recall how high above the ground you had the ESL63 placed? and what the mic distance was?
2) These appear to me to be visibility of the reflections between the dust covers and diaphragm...the cause of the resonances seen in the CSDs You might determine their times and back out the distance traveled by sound waves during that time. My guess is it will match with multiples of the round trip distance between diaphragm and dustcovers.
This is fascinating. I should still have the measurements I took in 2015 when I experimented with dust covers.
I will dig them up and see if spectrogram shows similar reflections appear in the top octaves when the dustcovers were added.
https://www.diyaudio.com/community/threads/all-acoustat-panels-can-give.282031/post-4551994
You might also try changing the wavelet frequency resolution.
- Lowering to something like 1/3oct should make the reflections more prominent.
- Increasing to 1/12oct should make the resonance decay with time more obvious.
1/3 oct with 5ms scale
1/12 octave
- Home
- Loudspeakers
- Planars & Exotics
- ESL high frequency chaotic modes?