Basotect is BASF's brand name for melamine foam, an open cell foam with a microporous structure. As it turns out, this structure not only makes it a good absorbent, but also an effective abrasive cleaner. So, surprisingly, for the issue at hand, the best solution might be to buy a sponge made of melamine foam and cut off slices to pad the Neo3.
The final blow for the L16
Just to be able to see the bigger picture, I moved the XO point to 2.3 kHz and measured again. The irregularity around 2.1 kHz is mostly gone, so I guess it really comes down to an issue of the Neo3 in the current mounting scheme.
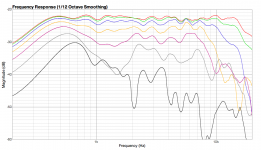
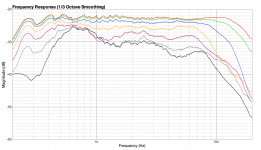
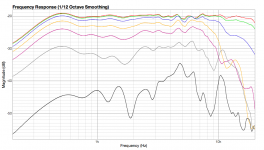
On the other hand, in this configuration the basic problem with the L16 becomes much clearer: As twest820 pointed out before, the off-axis response is (predictably) too much down above 800 Hz - while up to 700 Hz the driver becomes increasingly omni, leading to a peak in summed SPL around that freqency. Measurements with wider gating (and more smoothing) show exactly that:
So my conclusion finally is: Forget about the L16, get a TB W4-1320 tomorrow and measure again. Stay tuned.
Just to be able to see the bigger picture, I moved the XO point to 2.3 kHz and measured again. The irregularity around 2.1 kHz is mostly gone, so I guess it really comes down to an issue of the Neo3 in the current mounting scheme.

On the other hand, in this configuration the basic problem with the L16 becomes much clearer: As twest820 pointed out before, the off-axis response is (predictably) too much down above 800 Hz - while up to 700 Hz the driver becomes increasingly omni, leading to a peak in summed SPL around that freqency. Measurements with wider gating (and more smoothing) show exactly that:

So my conclusion finally is: Forget about the L16, get a TB W4-1320 tomorrow and measure again. Stay tuned.
Hi, can you share us how you measure them? I do not see the expected dipole radiation widens / null.
In my experience I had not been able to replicate outdoor measurement with in-room (even with gating). So I only trust freespace measurement (outdoor, elevated to 2m).
In my experience I had not been able to replicate outdoor measurement with in-room (even with gating). So I only trust freespace measurement (outdoor, elevated to 2m).
Since at the moment I'm not able to do any outdoor measurements, I'm measuring indoors from 1 m distance with 4 ms gating for frequencies above 1 kHz, and with 20 ms gating and serious smoothing for frequencies below that. I'm quite a beginner at doing that at all, so any comments on how reliable (or not) my measurements might be are very welcome!
It'll vary with room, tools, and technique, but in my not particularly live or dead living room that's somewhat smaller than 4 x 6m I get near exact agreement between indoor and outdoor 1m on axis SPL data from HOLMImpulse down to 500 or 600Hz. Phase is a fair bit noisier. Haven't taken a serious look at polars, though in this case the front polars are pretty predictable from the datasheet.
wowo101, you might want to measure the back polars before commiting to the Tang Bands.
wowo101, you might want to measure the back polars before commiting to the Tang Bands.
Since at the moment I'm not able to do any outdoor measurements, I'm measuring indoors from 1 m distance with 4 ms gating for frequencies above 1 kHz, and with 20 ms gating and serious smoothing for frequencies below that. I'm quite a beginner at doing that at all, so any comments on how reliable (or not) my measurements might be are very welcome!
My personal experience, the indoor method works for box speakers. For some reason I could never duplicate dipole outdoor measurement result when doing it indoor. Even when raising the speakers on chair.
Outdoor measurement is a real PITA unfortunately.
New driver, new luck
First of all, the back polars of the L16/Neo3 combination:
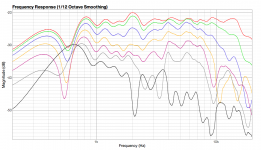
Quite ragged in the L16's range, as expected from the mounting scheme, but apart from that not too shabby concerning directivity - albeit with the same problems as the front polars show.
So, on to the new kid on the block: The Tangband W4-1320. I initially crossed it to the Neo3 at 2.3 kHz and took the following measurements:
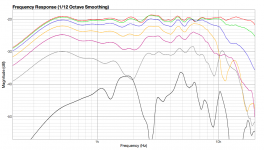
And I have to admit: Yes, that seems much better. Apart from the usual irregularities around 7 kHz (which I didn't yet treat in the current setup), the averaged response is now flat up to 8 kHz. I will try and move down the XO point below 2 kHz to see what this does concerning the wide dip between 1.4 kHz and 2.5 kHz starting at 60° off-axis.
The low end distortion of the Tangband and its limited replacement capabilities would of course mean to abandon the RiPole idea for the bass - maybe I should move to an H-frame, using two Peerless SLS 10 per side, going up to around 300 Hz. What do you think?
And yes: The whole project starts to look like cuibono's Violet by now. 😀 Considering that it was this project that got me started on DIYing myself, i guess this is just fair. 😉
First of all, the back polars of the L16/Neo3 combination:

Quite ragged in the L16's range, as expected from the mounting scheme, but apart from that not too shabby concerning directivity - albeit with the same problems as the front polars show.
So, on to the new kid on the block: The Tangband W4-1320. I initially crossed it to the Neo3 at 2.3 kHz and took the following measurements:

And I have to admit: Yes, that seems much better. Apart from the usual irregularities around 7 kHz (which I didn't yet treat in the current setup), the averaged response is now flat up to 8 kHz. I will try and move down the XO point below 2 kHz to see what this does concerning the wide dip between 1.4 kHz and 2.5 kHz starting at 60° off-axis.
The low end distortion of the Tangband and its limited replacement capabilities would of course mean to abandon the RiPole idea for the bass - maybe I should move to an H-frame, using two Peerless SLS 10 per side, going up to around 300 Hz. What do you think?
And yes: The whole project starts to look like cuibono's Violet by now. 😀 Considering that it was this project that got me started on DIYing myself, i guess this is just fair. 😉
Better than I'd expected, though my assessment is more conservative. Be interesting to see how the W4-1320 compares.Quite ragged in the L16's range, as expected from the mounting scheme, but apart from that not too shabby concerning directivity
Told ya. 😀And I have to admit: Yes, that seems much better.
My guess is the dip is diffraction off the W4-1320's surround, in which case lowering the crossover should result in improvement.I will try and move down the XO point below 2 kHz to see what this does concerning the wide dip between 1.4 kHz and 2.5 kHz starting at 60° off-axis.
I'm failing to reconstruct the reasoning as to why an H frame would offer better directivity characteristics than a ripole. Can you be more specific? 😛maybe I should move to an H-frame, using two Peerless SLS 10 per side, going up to around 300 Hz. What do you think?
My guess is the dip is diffraction off the W4-1320's surround, in which case lowering the crossover should result in improvement.
It did:
I'm failing to reconstruct the reasoning as to why an H frame would offer better directivity characteristics than a ripole. Can you be more specific? 😛
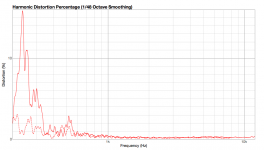
The reason for thinking about an H-frame instead of the ripole wasn't better directivity characteristics, but the limitations of the ripole at the upper end. With my 10" SLS, it should go up to somewhere around 250 Hz, and looking at the 1320's behaviour in these regions, that would be asking too much from those little TBs. From my measured NHD data I suspect I should perhaps even cross higher than 300 Hz... What would be a reasonable upper limit for the crossover point - I guess I'm already well into the range of the human voice with these numbers?
measurement
Generally on measurement
with the cost and difficulty of obtaining access to anechoic chambers or like conditions in recent decades I have fallen back on MLSSA and Clio gated methods with in-room data. A degree of fudging is necessary to get a passable approximation.
As others have explained, notably Keith Howard, it doesn't cut it.
True , ungated anaechoic tells you much more about the 80 to 2kHz range which is where it really happens, where tonal balance and colouration and their response reciprocals substantially affect the sound quality. Gated readings are too blunt , over smoothed, lacking detail, and the lf -mf stick together process leaves too much room for error.
An old pen recorder B&K slowly winding its way through the spectrum finds micro detail in responses which is audible and attributable but is invisible to gated , in room evaluation.
All that it does well in my view is allow low cost blending of mid to treble.
In review , in terms of available resources how do I get the likes of a Wilson MAXX III into an anechoic chamber? Of necessity my published results are quite approximate.
The BBC timbre/colouration standards were achieved by listening comparisons with live sound and familiar recordings and painstaking analytical work backed by high resolution anechoic measurements , ungated.
We may not even now be able to approach these standards without a greater respect for measurement clarity/resolution in the mid and lower mid range.
Martin Colloms
Tech Ed HIFICRITIC
HIFICRITIC, audio review magazine, hi fi critic
I'd just try it out. My speaker blew me away even with my initial XO at 450Hz (according to Rudolf's site). I didn't really experiment with it though. I just read specs about some 3000$ Klipsch horns and the got the XO at 500Hz I think.
At 300Hz you would be below the female voice range. I read it's 12dB down at 300Hz (male at 120Hz) and the most output is at about 500Hz IIRC.
At 300Hz you would be below the female voice range. I read it's 12dB down at 300Hz (male at 120Hz) and the most output is at about 500Hz IIRC.
Attachments
I think you forgot to post the distortion data. 😛What would be a reasonable upper limit for the crossover point - I guess I'm already well into the range of the human voice with these numbers?
If you want the crossover to be most transparent the three criteria I'd use---assuming no major driver issues such as with the L16, which should be the case with the 1320 and 830668---would be distortion, phase linearity, and directivity. The 1320's a bit small for good vertical dispersion in crossing to a pair of 830668s, though with low peak SPL requirements it could end up OK. Linear versus warped phase is mostly orthogonal to driver selection. So that leaves distortion.
Have you tried running the 830668s nude yet?
Depends on the nature of the gating. If it's windowing of the impulse response, I agree. If it's controlling the time when data is acquired from the mic such that only direct sound is captured I disagree. However, I'm not aware of any measurement tool which reliably supports that (see post 3 in this thread).True , ungated anaechoic tells you much more about the 80 to 2kHz range which is where it really happens, where tonal balance and colouration and their response reciprocals substantially affect the sound quality. Gated readings are too blunt , over smoothed, lacking detail, and the lf -mf stick together process leaves too much room for error.
Thanks for the instructive replies! I'm learning every time I come here.
Here's the requested distortion measurement - sorry for not posting it earlier. It's measured on axis with approx. 75 dB SPL @ 1 m, 4 ms gating.
XO to the Tangband is LR4 @ 200 Hz, from the Tangband to the Neo3 LR4 @ 1.8 kHz. Especially since SPL is still quite low, I'm guessing crossing at 300 Hz or lower to the Peerless units might be problematic.
I've started listening to the mono L16/Neo3 and 1320/Neo3 setups this weekend, and the latter sounds very smooth and uncoloured, almost to the point of being a bit more "boring" than the L16 setup. I guess this indicates the (almost total) absence of midrange NHD when compared to the L16 and its - for the lack of better words - more metallic sound. But maybe I'm just rationalizing my recent investment here... 😀
Anyway, with both setups I was blown away by the naturalness and richness in detail they provided compared to my old box speakers! Voices just sounded "real", and when listening to "It happens each day" by The Byrds (my favorite originally unreleased song by them), I noticed some guitar fingerpicking through most of the song I was totally unaware of up to now. (I don't know if it adds to the song, but hey! That's how they recorded it. 😉 )
As to my SPL requirements: The levels I'm using right now are already a bit above my usual neighbour friendliness, and even Zinman's Beethoven recordings I usually crank up more were already sufficiently intense - maybe again a sign of how well the drivers reproduce musical detail when run naked.
I didn't have a chance yet to measure (and listen to) the Peerless units since the parts for my 6-channel Gainclone are still waiting to be assembled - I'm using my old Rotel 2-channel amp to do the testing. I hope to pair the Peerless and the Tangband for some initial measurements during the next days.
Here's the requested distortion measurement - sorry for not posting it earlier. It's measured on axis with approx. 75 dB SPL @ 1 m, 4 ms gating.

XO to the Tangband is LR4 @ 200 Hz, from the Tangband to the Neo3 LR4 @ 1.8 kHz. Especially since SPL is still quite low, I'm guessing crossing at 300 Hz or lower to the Peerless units might be problematic.
I've started listening to the mono L16/Neo3 and 1320/Neo3 setups this weekend, and the latter sounds very smooth and uncoloured, almost to the point of being a bit more "boring" than the L16 setup. I guess this indicates the (almost total) absence of midrange NHD when compared to the L16 and its - for the lack of better words - more metallic sound. But maybe I'm just rationalizing my recent investment here... 😀
Anyway, with both setups I was blown away by the naturalness and richness in detail they provided compared to my old box speakers! Voices just sounded "real", and when listening to "It happens each day" by The Byrds (my favorite originally unreleased song by them), I noticed some guitar fingerpicking through most of the song I was totally unaware of up to now. (I don't know if it adds to the song, but hey! That's how they recorded it. 😉 )
As to my SPL requirements: The levels I'm using right now are already a bit above my usual neighbour friendliness, and even Zinman's Beethoven recordings I usually crank up more were already sufficiently intense - maybe again a sign of how well the drivers reproduce musical detail when run naked.
I didn't have a chance yet to measure (and listen to) the Peerless units since the parts for my 6-channel Gainclone are still waiting to be assembled - I'm using my old Rotel 2-channel amp to do the testing. I hope to pair the Peerless and the Tangband for some initial measurements during the next days.
Which means I wouldn't trust it below 1kHz or so. You might be OK to 500Hz depending on how the amplitude of the fundamental's acquired, but from the data I'm sceptical. Close micing a few different parts of the cone and leaving the measurements ungated should work as a quick fix.It's measured on axis with approx. 75 dB SPL @ 1 m, 4 ms gating.
What's the difference between the dashed and solid lines?
Thanks for the suggestion, twest820. The following measurements were taken ungated at the same level as the last ones, but from 10 cm distance, focused at the center of the 1320's cone as well its left, right, top and lower end. The solid lines are 2nd, the dotted lines 3rd harmonics. Only the 1320 was measured.
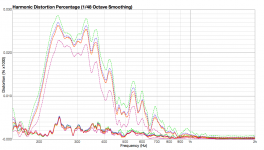
If I am to trust the data (of which I'm not sure), I'm into serious trouble at the lower end of the 1320's range: Almost 30% 3rd order distortion?! Could it be there's something going on here beside the driver's original NHD, as there's an order of magnitude (!) between 2nd and 3rd harmonics? On the other hand, the lines of both harmonics show the same relative characteristics...
I'm quite at a loss here... Should I trust those measurements?
I'm not familiar with the software you're using, but % x1000 would usually mean the top of the graph's 0.00003%. That's unrealistically low, so either way there would seem to be measurement problems here. % x1 would be believable if it weren't for the distortion falling below 250Hz or so. You might try HOLMImpulse or close micing at a more typical distance such as 10mm (or closer if you've good control over the cone excursion).
An order of magnitude difference between orders is larger than average but hardly common in my experience. See also Zaph's small woofer measurements.
An order of magnitude difference between orders is larger than average but hardly common in my experience. See also Zaph's small woofer measurements.
I'm using FuzzMeasure, and up to now, it was quite reliable. Maybe I was looking at this all wrong, but I thought "% x 1000" would mean the exact opposite - taking the values shown times the factor given would give me the real values. I'd guess you're right, since otherwise the scaling wouldn't make much sense. But the dB-based NHD plot FuzzMeasure gives me really shows a 30% distortion...
Micing as close as 10 mm gives me basically the same results, this time with a value 10 times smaller and a multiplicator (y-axis label) 10 times greater. So I guess this is how FuzzMeasure expresses itself... 😉
Considering all this I should ask the developer of FuzzMeasure about how to interpret the axis labels - usually he's an extraordinary helpful guy. (As you can see, I'm reluctant to move away from my MacOS based tools - but then again, I was reluctant to move away from the L16, to... 😉 )
Concerning the order of magnitude: I'm still not used to converting between dB and percentage - my fault. Of course, 10 dB IS an order of magnitude when expressed as a percentage value... 😱
Anyway - thanks a lot for your guidance!
Standard debugging procedure is to keep accumulating data until you can explain what's going on. Since changing the mic, source, amps, or software is a bit of a hassle the obvious next step is to change the driver and, if you haven't already, see if you get similar results from both 1320s. If so, that would suggest a look at the L16s and 830668s to determine if it's a 1320 specific issue or something that applies to all drivers (which would suggest the issue's with something other than the drivers).
Odd.Micing as close as 10 mm gives me basically the same results, this time with a value 10 times smaller and a multiplicator (y-axis label) 10 times greater. So I guess this is how FuzzMeasure expresses itself... 😉
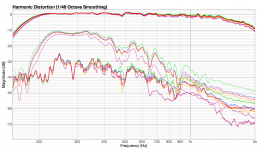
So, I followed your advice and measured the other drivers. The following chart shows the 1320, the L16 and a Peerless 831883 I had lying around. Measured approx. from the same distance (a few cm) and at the same level, ungated. XO LR4 @ 200 Hz and 1.8 kHz.
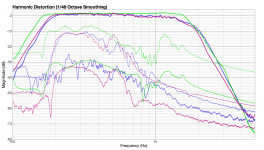
Since the HD displayed shows very similar levels and characteristics, I guess the problem is not the 1320, but either my measuring equipment (calibrated Behringer ECM 8000, Alesis i|o2, MacBook Pro) or indeed the software (FuuzMeasure, as mentioned).
Next I'll export the measurement data and see what other software packages do with it.
Thanks for the debugging advice!
With close micing and the results you've got so far the most likely culprit's the noise floor of the iO2. Maybe also the gain stability depending on where you've got the preamps set. Have you measured those?
Last edited:
- Status
- Not open for further replies.
- Home
- Loudspeakers
- Multi-Way
- Driver evaluation for OB project
