What about the mic? At that distance, it could be seeing pretty high SPL levels, unless "at the same level as the last ones" means you dropped the level to be 75dB @ the measuring distance.
If it was the mic I'd expect distortion and measured SPL to track more closely together. Also, I haven't seen similar problems with my Dayton EMM6 (which is either very similar to the ECM8000 or somewhat better, depending on when the ECM8000 was made). A damaged mic's always a possibility but clipping's a more likely problem. It occurs to me I've been assuming FuzzMeasure pops the usual warning dialog when clipping happens, but perhaps that's not the case.
Ok guys, I guess i have to retract from the blameshifting: Neither the i|o2 nor the mic is the problem - the driver is.
The i|o2's noise floor is flawless (about -100 dB measured), and playing with gain didn't show any irregularities. The ECM 8000 is said to be reliable distortion-wise to well above 100 dB SPL, and my own experiments with high SPL didn't show any signs of clipping.
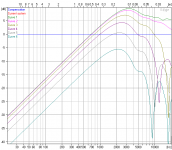
Next I tried to simulate Zaph's distortion measurement setup (ungated, 90 dB SPL @ 0.5m), and the results were again frustrating: Extremely high 3rd order distortion around 300 Hz, high 2nd order everywhere below 800 Hz. Both 1320 drivers showed the same behaviour, and most importantly: It was VERY audible. Playing with sinus tones at the respective frequencies and listening closely corroborated these data.
Pulling down SPL about 6 dB removed the 3rd order problems, only leaving some 2nd order peaks (30 dB down) below 800 Hz, which were nevertheless still audible from close distance.
Since I also changed the mounting scheme to eliminate resonances from the stand, that leads me to the conclusion that the 1320s are very severely limited in SPL at lower frequencies when used naked. Even if cross them at around 400 Hz, which removes the nasty rasp at high SPL, I still can't push them beyond 80 dB SPL @ 0.5m without getting serious distortion.
This seems to leave me with the following options:
a) Change the midrange driver back to a larger one and live with worse horizontal midrange dispersion.
b) Accept the 1320 limits and stay true to my stated (very low) SPL goals.
c) Try an MTM configuration, running two 1320s in parallel for each channel.
If I stay with the 1320, this in any case means having to drive the bass units up to around 400 Hz, which (again) would be similar to cuibono's Violet configuration.
Any opinions about that?
The i|o2's noise floor is flawless (about -100 dB measured), and playing with gain didn't show any irregularities. The ECM 8000 is said to be reliable distortion-wise to well above 100 dB SPL, and my own experiments with high SPL didn't show any signs of clipping.
Next I tried to simulate Zaph's distortion measurement setup (ungated, 90 dB SPL @ 0.5m), and the results were again frustrating: Extremely high 3rd order distortion around 300 Hz, high 2nd order everywhere below 800 Hz. Both 1320 drivers showed the same behaviour, and most importantly: It was VERY audible. Playing with sinus tones at the respective frequencies and listening closely corroborated these data.
Pulling down SPL about 6 dB removed the 3rd order problems, only leaving some 2nd order peaks (30 dB down) below 800 Hz, which were nevertheless still audible from close distance.
Since I also changed the mounting scheme to eliminate resonances from the stand, that leads me to the conclusion that the 1320s are very severely limited in SPL at lower frequencies when used naked. Even if cross them at around 400 Hz, which removes the nasty rasp at high SPL, I still can't push them beyond 80 dB SPL @ 0.5m without getting serious distortion.
This seems to leave me with the following options:
a) Change the midrange driver back to a larger one and live with worse horizontal midrange dispersion.
b) Accept the 1320 limits and stay true to my stated (very low) SPL goals.
c) Try an MTM configuration, running two 1320s in parallel for each channel.
If I stay with the 1320, this in any case means having to drive the bass units up to around 400 Hz, which (again) would be similar to cuibono's Violet configuration.
Any opinions about that?
Doesn't explain the high distortion on the L16 and 831883, though.
😛d) Go 4-way.
Doesn't explain the high distortion on the L16 and 831883, though.
Of course you're right - I'll do some additional measurements when I'm through with my jetlag...
On a different but related subject: Rudolf convinced me that with all the fuss around Basotect for the (non-PDR) Neo3 I was totally off the mark. The irregularities around 7 kHz obviously have less to do with edge diffraction than with a behaviour totally expected from any dipole tweeter before beaming sets in. My apologies for being misleading - and a big recommendation for Rudolf's PDF on open baffle dipoles: dipol+ Downloads (Achtung: German content!)
My German isn't what it could be but I'm not spotting an explanation of the underlying physics in Rudolph's paper. The assertion's it's front to back wave cancellation?
Some call it edge diffraction, some call it front to back cancellation. Isn't it exactly the same thing in the end because everything from the back has to come around the edge to reach the listeners ear?My German isn't what it could be but I'm not spotting an explanation of the underlying physics in Rudolph's paper. The assertion's it's front to back wave cancellation?
I don't explain any physics in that paper - others have done it better than I could. Basicly I want to explain how mounting a small driver on a big baffle results in a different radiation pattern and behaviour than mounting a big driver on a small baffle (both not in absolute terms, but in relation to one another). This includes that some good strategies for the first case become bad strategies for the latter. Turning point is the first dipole peak. You have to decide whether you want to optimize your design for below that peak or above. Optimizing for both sides at the same time seems impossible to me. If you have a three way system, you can of course change the strategy for each driver. But that could result in some inhomogenities in the X-over region.
I will do an english translation for this paper when the content has finally been settled.
Rudolf
I won't claim my Edge model of the Neo3 is perfect. But a rectangular baffle the size of the Neo3 with a rectangular driver the size of the Neo3's holes should be close enough to capture the basic response. But the agreement of the model with both my measurements and wowo's is quite poor. The attached is with 3500 point sources and 15 degree separation between curves; I've taken it up to 16000 without seeing much change. So, while Edge has been found to be good at predicting the dipole peaks of nude woofers---and perhaps by extension the compact dynamic tweeters you've been studying---it seems there's things going on with the Neo3 that the source and edge diffraction model doesn't capture. That might imply a difference between a back wave and an edge source. Or perhaps it's just that a 3D model is required.
What did you use to generate the figures in the paper? From the look and feel I'd guess Edge.
What did you use to generate the figures in the paper? From the look and feel I'd guess Edge.
Attachments
Last edited:
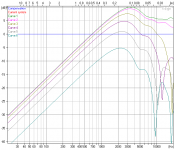
I thought it had modeled the Neo3-PDR response fairly well (at least, to the extent of predicting the 7kHz on-axis dip). I think I'd used the dimensions of the inner 2 rows of holes as the 'driver' size, and the dimensions of the Neo3 as the 'baffle'. Did you try that too by any chance? I don't think I have the graphs saved.
No, but it's quick to generate the data. 😛 Center two columns is a better approximation for the non-PDR, which might suggest even without the PDR foam most of the SPL comes from the middle of the diaphragm. Seems sensible enough, but the model's still poor (left attachment). Excluding the top and bottom row and taking only the center six openings improves the accuracy somewhat (right attachment), which supports the hypothesis. One could probably tinker around with the source distribution and shape and eventually get a reasonable approximation of measured results above the influence of the Neo3's Fs, which seems to be about 650Hz and fairly high Qts. However, I'm unsure how one would determine what to simulate a priori of measurements.
If BG Radia ever calls me back I'll have some more informed questions to ask, though.
If BG Radia ever calls me back I'll have some more informed questions to ask, though.
Attachments

I went back through my thread on HT Guide to see what sims we had come up with. Here's is Dennis (catapult's) sim:
HTGuide Forum - View Single Post - Getting back to my OB design...
Not an exact match, but the general trends are visible. But I agree with you, all of this is after-the-fact simulations when we already have the measurements.
HTGuide Forum - View Single Post - Getting back to my OB design...
Not an exact match, but the general trends are visible. But I agree with you, all of this is after-the-fact simulations when we already have the measurements.
In the introduction to my paper I caution that all sims are for pistonic drivers only. And I explain why I don't want to simulate for real world drivers.I won't claim my Edge model of the Neo3 is perfect. But a rectangular baffle the size of the Neo3 with a rectangular driver the size of the Neo3's holes should be close enough to capture the basic response. But the agreement of the model with both my measurements and wowo's is quite poor.
The Neo3 MUST move more in the middle than at the four sides. So you have to assume a smaller radiating area. Apart from that: Did you look at the 11 mm depth of the housing? You need to add at least 5 mm width to each of the four sides of the Neo3 to account for the missing depth of the model.
I could easily accept that my models are not refined enough to do full justice to real world drivers. But you will have a hard time to convince me that a back wave and an edge source follow different physics. 😉That might imply a difference between a back wave and an edge source.
If we really want to know we need to resort to some sort of FEM analysis - 3D alone won't suffice imho.Or perhaps it's just that a 3D model is required.
Yes, it is Edge wherever you see 0 dB on the vertical scale. In the few cases when you see values of 50 or 80 dB it is Boxsim.What did you use to generate the figures in the paper? From the look and feel I'd guess Edge.
Rudolf
It's not clear to me the Neo3 diaphragm is secured on all four sides; the long sides are hidden behind bar magnets. So one would either have to find out from BG Radia or crack one open. My non-PDR 3Ws are in active use, so I'm not about to drill out the rivets.
Similarly, I'm unsure there's an open and shut case for depth accounting. Saurav's link above mentions greater than 11mm increases in width but the source configuration is unclear. For the woofers I've run dipole Edge has predicted the dipole peak within the limits of measurement precision without an allowance being made for the thickness of the mounting flange. Which, in some cases, is up to 8mm. The woofers are, of course, bigger than the Neo3. So errors from incorrect depth allowances will be smaller and harder to detect.
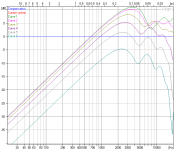
The figures above are based on the physical measurements of my 3Ws and don't add any baffle extent for depth. The figure below uses the center six openings and a baffle expanded by 5.5mm on each side to account for depth. It's different from the others but I can't say I see it being in better agreement with measurement.
Similarly, I'm unsure there's an open and shut case for depth accounting. Saurav's link above mentions greater than 11mm increases in width but the source configuration is unclear. For the woofers I've run dipole Edge has predicted the dipole peak within the limits of measurement precision without an allowance being made for the thickness of the mounting flange. Which, in some cases, is up to 8mm. The woofers are, of course, bigger than the Neo3. So errors from incorrect depth allowances will be smaller and harder to detect.
The figures above are based on the physical measurements of my 3Ws and don't add any baffle extent for depth. The figure below uses the center six openings and a baffle expanded by 5.5mm on each side to account for depth. It's different from the others but I can't say I see it being in better agreement with measurement.
Attachments
See, to me, that seems to match my Neo3 PDR measurements fairly well, once you account for non-linearities in the driver's basic response. Here's the most recent measurement I could find:
HTGuide Forum - View Single Post - Getting back to my OB design...
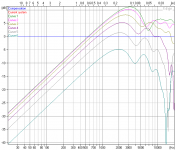
Last image in that post. The image is fairly jumbled in the range of interest, but you can see that the on-axis plot has the deepest null at ~7Khz (purple), while the off-axis curves don't have that null. Also, the peak is at ~3kHz. For my measurements the Neo3 is mounted on top of an 8" wide baffle, so that will skew the results.
HTGuide Forum - View Single Post - Getting back to my OB design...
Last image in that post. The image is fairly jumbled in the range of interest, but you can see that the on-axis plot has the deepest null at ~7Khz (purple), while the off-axis curves don't have that null. Also, the peak is at ~3kHz. For my measurements the Neo3 is mounted on top of an 8" wide baffle, so that will skew the results.
Whereas the one that looks like the best match to wowo's measurements to me is the one that follows your PDR simulation approach. We can start the DIYAudio magnetostat Rorschach test. 😛
Another thing I thought of - for the PDR, I think the effect of the felt along the outer edges would be to narrow the radiating area for the higher frequencies, but not for the lower frequencies. While I'm pretty sure EDGE models driver directivity at some level, I don't think it can directly model that. So one would have to map out both driver diameters, then blend the responses over some frequency range.
And by that point it's easier to just measure 🙂
And by that point it's easier to just measure 🙂
Agreed. It's not like the Neo3 really has any competition since it clobbers other planars on distortion, low frequency reach, and beats most of them on price. So, from a pragmatic standpoint, it is what it is. Basically, you either live with that or start building your own driver. However, I've a few ideas around milling down the flange on the Neo3 and doing some lap joint stuff to mount a Neo3 to a Neo8. Some sort of predictive modeling capability is attractive there, since undoing mistakes gets expensive rather quickly.
- Status
- Not open for further replies.
- Home
- Loudspeakers
- Multi-Way
- Driver evaluation for OB project