- Whatever you can (or cannot) see at F=39k is of little importance, as it is out of the audio band anyway. In an IMD test, you look at in-band intermodulation products.
- With the 19k+20k test signal, even-harmonic-generating non-linearities will generate intermodulation products at 1k, 2k, 3k, etc., while non-even - at 18k/21k, 17k/22k, 16k/23k, etc.
- In a feedback amp, the loop gain is often lower at the top end of the audio band. Beacuse of that it is super easy to get -160dB THD @ 1kHz, but getting the same low level for the 18k intermod is more difficult.
- You "noise" floor still looks high. Below are typical results of transient simulations of two high-loop-gain, low-distortion power amps. Note the floor at -220dB or so.


Last edited:

Here you go.Would be great if you could post an image of such spectrum made relevant by adding a noise generator. Thanks.
The amp you sent me didn't work and a number of transistors were missing in the DIYAamp.txt.
So I used another amp, a Luxman 400.
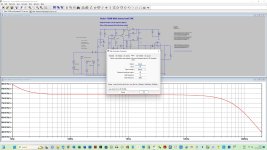
I started finding its -3dB point, see first attachment, it's roughly 200Khz.
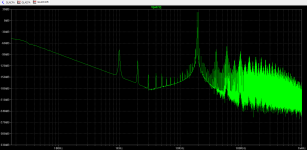
Then in the second attachment I measured the noise at the output, ca 137nV/rtHz or 55uV over the 200Khz BW
Third attachment shows in transient mode the LS output signal from a behavioral voltage source at the amp's input, in this case with V=White(1e6*time)/73000
The factor 1e6 determines the noise BW and the factor 73000 it's amplitude.
This was of course after some trial and error to find the right figures.
In the third attachment the Sim was done with a 1 sec sim time for getting the filter bins at 1Hz, to compare it with the 137nV/rtHz measured before.
As can be seen at the insert in the time signal, amplitude is even a bit too low with 50uV instead of 55uV in attachment 2, but it's close enough in this case.
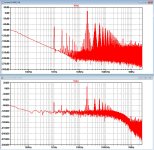
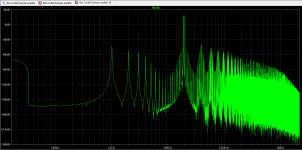
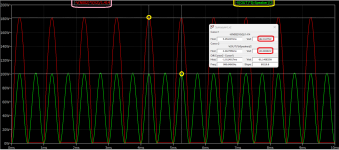
Fourth attachment shows the IM with 19Khz and 20Khz.
In the upper part without the noise generator and in the lower part with noise generator.
That's it.
Hans
Attachments
@alexcp,
I concur with your first 3 points. Those amps represented by the FFTs in #4 must be excellent sounding amps designed by highly experienced designers. Ou of curiosity I plotted IMD plots for below designs for which I could locate ASC files.
1) Bob Coredell - (Someone created the ASC file from the example diagram in his book. Not a finished product.
2) SYSSYM4 - The craze 10-12 years back
3) GLACFA - CFA Design by uncle OStripper who started the huddle CFA vs VFA.
When compared my design with these, I feel that my figures are close to and in couple of cases little better than these 3. Of course, the high noise floor level is because of the way I used zeners at sensitive points which leaves a scope for correction. But as I said before I wanted to explore unconventional characteristics of these regulator devices.
Attached are the IMD plots for the 3 case-studies.
I was complacent that I am in the same league but your examples triggered my mind to replace to them with conventional devices and measure the noise floor. I am expecting to understand the standard practice to measure noise by adding the noise generator from @Hans Polak. Awaiting a reply from him.
regards,
Prasanna
Attachments
Received your reply while writing to Alexcp. I will go through it. Thanks @Hans PolakI was complacent that I am in the same league but your examples triggered my mind to replace to them with conventional devices and measure the noise floor. I am expecting to understand the standard practice to measure noise by adding the noise generator from @Hans Polak. Awaiting a reply from him.
Last edited:
What works for me is to export the LTSpice's time signal into a .wav file with the .Wave command.BTW is there a way to do spectral averaging in LTSpice?
Next read that .wav file into RMAA, where overlapping FFT's of selectable sample sizes can be chosen, resulting in noise spectra with very much less noise.
Hans
Dear Hans,
A more detailed explanation of the procedure, step by step, with figures if possible, will be very useful for us beginners. Please !
A more detailed explanation of the procedure, step by step, with figures if possible, will be very useful for us beginners. Please !
Can you tell in what application you prefer to have less noise in the spectrum.A more detailed explanation of the procedure, step by step, with figures if possible, will be very useful for us beginners. Please !
That enables me to explain close to what you would like to achieve.
Hans
Please see for tian probe files etc.: https://www.diyaudio.com/community/threads/retro-tgm8-with-tmc-laterals-and-80db-olg-20-khz.419343/
@alexcp ,@alexcp,
I concur with your first 3 points. Those amps represented by the FFTs in #4 must be excellent sounding amps designed by highly experienced designers. Ou of curiosity I plotted IMD plots for below designs for which I could locate ASC files.
1) Bob Coredell - (Someone created the ASC file from the example diagram in his book. Not a finished product.
2) SYSSYM4 - The craze 10-12 years back
3) GLACFA - CFA Design by uncle OStripper who started the huddle CFA vs VFA.
When compared my design with these, I feel that my figures are close to and in couple of cases little better than these 3. Of course, the high noise floor level is because of the way I used zeners at sensitive points which leaves a scope for correction. But as I said before I wanted to explore unconventional characteristics of these regulator devices.
Attached are the IMD plots for the 3 case-studies.
I was complacent that I am in the same league but your examples triggered my mind to replace to them with conventional devices and measure the noise floor. I am expecting to understand the standard practice to measure noise by adding the noise generator from @Hans Polak. Awaiting a reply from him.
regards,
Prasanna
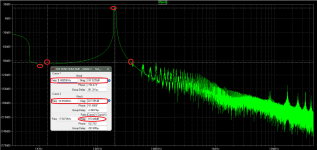
I have improved the design and now the IMD FFT looks like this. All difference frequencies between 1k and 5k are pushed down below 115Db from the two base frequencies. The very first diff frequency component of 1k is 118Db down from the base. The FFT is with Hann windowing. What I want to highlight is that compared to above example IMD FFTs, there are no spikes in the audible band. Might be still there is a flaw in the way I generated it.
I am excited to listen to the sound, but I have to wait till I build it till the tie bandwidth allows me.
What is your take and feedback? Of course, high noise floor of ~180Db is still there.
Prasanna
@gannaji,Dear Hans Polak,
I am including the diagrams and the .asc file.
1, THD at 10KHz, 16V p-p.
2. IMD at 19-20 KHz, 16V p-p.
3. .ASC file.
View attachment 1384868View attachment 1384869
Thanks for sharing the FFTs. I am wondering, how do you generate The Empire State building the FFT at 19k and 20k. I am wondering why I am not getting it. Do you set any specific parameter for it?
Prasanna
Attachments
dear Prasanna,
All the parameters are in the .asc file. Probably, the run time is specified and not number of cycles in my parameters. The long run time does that Empire State building type graph.
--Sarma.
All the parameters are in the .asc file. Probably, the run time is specified and not number of cycles in my parameters. The long run time does that Empire State building type graph.
--Sarma.
In the design under development,
Image1 - the quiescent current in power and driver transistors doesn't cut off. Achieved with only a couple of transistors with few passive components.
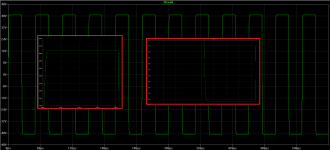
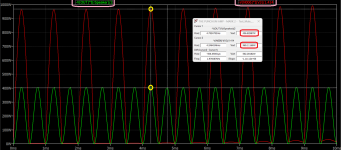
Image2 - 1.414V square wave (bi-voltage) driving 8 Ohm resistive load (42v pk-to-pk output). There are no overshoots.
With 1.414v RMS (some people would like to use the term average) input, the design delivers 100W.

The difference between two quiescent currents (upper halve and lower halve) may be due to model differences. I assume the currents can be matched with preset.
Prasanna
Image1 - the quiescent current in power and driver transistors doesn't cut off. Achieved with only a couple of transistors with few passive components.
Image2 - 1.414V square wave (bi-voltage) driving 8 Ohm resistive load (42v pk-to-pk output). There are no overshoots.
With 1.414v RMS (some people would like to use the term average) input, the design delivers 100W.
The difference between two quiescent currents (upper halve and lower halve) may be due to model differences. I assume the currents can be matched with preset.
Prasanna
Attachments
Last edited:
If your FFT cannot resolve between 19 and 20 kHz peaks and shows them as one lump, there must be something wrong with your settings. It is possible that the same thing makes the floor as high as -90dBV in the audio range, but I am not sure.What is your take and feedback?
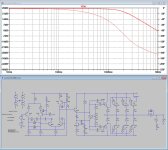
Start by running the noise command, use V(out) for the noise output and V3 as the source.Dear Hans,
A more detailed explanation of the procedure, step by step, with figures if possible, will be very useful for us beginners. Please !
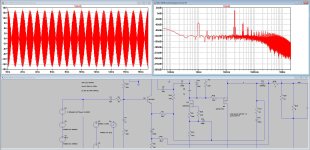
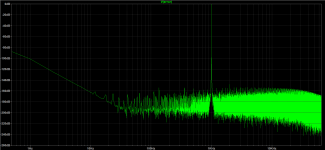
See result in the first image.
Output noise is ca 78nV/rtHz and BW is ca 140Khz.
This adds up to slightly below 30uV = 78e-9*sqrt(140K)
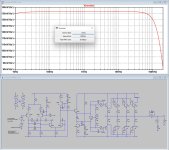
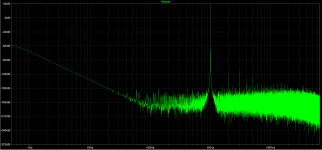
Now use the White command for a behavioral voltage source.
Some fiddling results in 3.7e5 for the 140Khz BW and 114000 for getting the right level.
Use a 1 second running time to get 1Hz bins, shorter is of course possible but be aware in the FFT of the larger bin width.
See output level in second image being almost the above calculated 30uV.
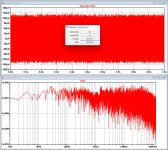
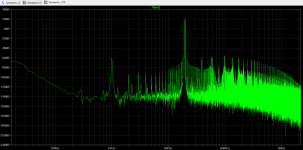
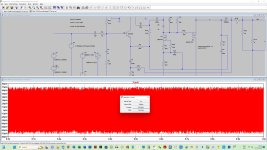
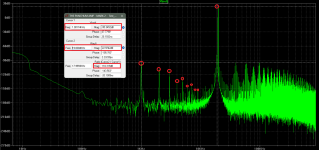
As a last step run your IMD test and add the white noise generator B1 to your 19Khz+20Khz sources V3 and V5.
Final result visible in third attachment.
Hope this answers your question.
Success
Hans
P.S. You mention to being a beginner, but using the Tian stability test is not exactly beginners stuff 🤣
Attachments
"P.S. You mention to being a beginner, but using the Tian stability test is not exactly beginners stuff "
The tutorials and 'copy-paste' help me.
The tutorials and 'copy-paste' help me.
@alexcp ,What is your take and feedback? Of course, high noise floor of ~180Db is still there.
I can't overcome the 160Db noise floor barrier because of Zener diodes. However, I could refine the THD and IMD FFTs. But the point I highlight is my 1k to 9k peaks are below 118Db down (minimum) from the base frequencies. What matters more for the musicality is the strength of the IMD harmonics than how low is the noise floor (except front end devices in the audio value chain).
Overall I believe that I am doing the things right except lowering the noise floor.
Let me turn to Hans and execute his noise generator suggestions.
Prasanna
Attachments
Last edited:
Found another useful thread that sheds some light on measuring IMD -> How to do IMD simulation n LT-Spice
Reopening this thread with another query that I am facing. I am considering the power specifications for the Amp that I have designed. 100W into 8 Ohms, 200W into 8 Ohms, and 400W into 2 Ohms (transient). When I am measuring the power consumption in the resistive of 2ohms and the +ve supply rail, I get tremendous difference. While the dissipation in the load is 400W, the same in the positive supply rail 970W. And that too dividing the VI product by 1.414 as voltage is constant. What I unable to understand is where the remaining 570 watts are being consumed or my calculation method is incorrect.
Attachments
I have found similar results repeating for Symasym4v2 amp. Where the remaining 81watts are going? The supply rai of this amp runs at 36V with 100mA quiescent current. Add this 3.6watts to the 100 watts and dissipation in the front end is 219mW. Where is the difference?
Attachments
Last edited:
IMHO you have two problems:
1. Your "fudge factors" are incorrect. Plot -V(OUT)*I(rSPEAKER) and -V(N002)*I(V2) instead, and suddenly peak output power becomes about 80% of peak power drawn from the power supply, as it should be.
2. If you want to accurately calculate efficiency, you'll need to average your power graphs (click graph name while holding <Ctrl>), plus either multiply the power supply value by 2 or also plot power drawn from the other rail. (The theoretical maximum for a push-pull AB is 78.5%, and efficiency rapidly deteriorates when output power is reduced. Maximum amplifier losses occur at about 1/3 of maximum output power.)
- Home
- Amplifiers
- Solid State
- Downward Pointing Harmonic Peaks in LT Spice FFT. Is The Design Correct?