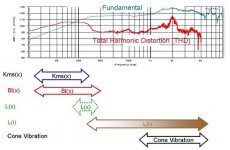
Below is display of sources of Non-linearity in drivers.
Note that (green) L(x) is a source of excursion modulation of inductance, while (brown) L(i) is a source of flux (current) modulation of inductance. The current variation is largely an effect in larger (and larger) woofers.
Also note that the display freq. range is where these problems typically occur for a driver.. BUT that cone vibration in particular (if it's not well controlled) will effect the driver throughout the freq. range by effecting coil position within the gap. Drivers with lighter compliant surrounds are particularly prone to this
The driver displayed appears to be a midrange/fullrange driver with an Fs likely near the cross-point of Bl and Kms.
Attachments
Those up slopes too. All do it except H2, which seems to follow the beat of its own drummer. THD is just almost copy of H2, so it could be turned off.I also wonder about the sweep itself (..its freq. extension) when I see very ordered "up-lifting" upper harmonics higher in freq..
Or distortion in the driving amplifier?
dave
Hey Dave, hope your doing better! 🙂
Noise is a "global" (multiple sources) thing in these cases, however..
JohnPM created REW (..which I believe was used for those harmonic distortion sweep plots), and this is what he has to say about (..and is much better at explaining it than I):
Speaker Distortion - REW Measurements - AVS Forum | Home Theater Discussions And Reviews
Speaker Distortion - REW Measurements - AVS Forum | Home Theater Discussions And Reviews
Last edited:
Those up slopes too. All do it except H2, which seems to follow the beat of its own drummer. THD is just almost copy of H2, so it could be turned off.
My guess is that 3rd is good to about 5 kHz in that graph.. and after that is pure crap. 😱
..and yeah, THD is pretty much useless.
Last edited:
I guess we could all discuss in vague terms.In a speaker it is actually difficult to generate anything beyond 3rd.
dave
But in response to your actual post: not really.
I tend to wonder how much of those upper (higher-order) harmonics are elevated due to the noise floor of the overall measurement..I also wonder about the sweep itself (..its freq. extension) when I see very ordered "up-lifting" upper harmonics higher in freq.. (..which is stuff I personally disregard.) 😉
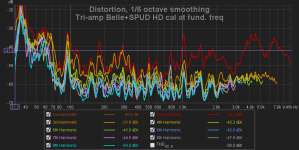
The choice with the calculations of each harmonic is: 1) calculate vs. the output at the fundamental frequency SPL (i.e., old school), and 2) calculate vs. the output at the harmonic frequency (when you think about it, this should be the way that it calculates). The choice that I used was "2)" for that plot. You can also select "1)" to see that plot, too:
Chris
Attachments
Last edited:
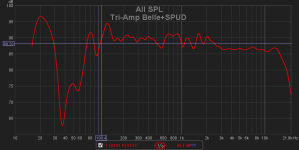
Perhaps a FR plot will illuminate a bit. This was 3 years ago when the Belle was set up as a center between two Jubilees using a sub only crossed at 40 Hz. The drop in LF output of the following plot was due to that condition at that time of using only one crossover frequency to the SPUDs: 40 Hz. I later changed it to 70 Hz for the Belle center channel only, and 40 Hz for the Jubs, and that FR drop out was bridged more successfully.

The 2-way JuBelle configuration (K-402 on top with B&C DE750) is much cleaner in terms of HD, even at 100 dB/1m, but 'll spare you...
The 2-way JuBelle configuration (K-402 on top with B&C DE750) is much cleaner in terms of HD, even at 100 dB/1m, but 'll spare you...
Attachments
Last edited:
The output of what? Method 1 is easy, but 2 seems to be missing something.2) calculate vs. the output at the harmonic frequency
Look at the FR plot--that's why I posted it. The following from the help file:
If Use harmonic frequency as ref is selected the reference will be the frequency of the harmonic - for example, at 1 kHz the 2nd harmonic figure will depend on the level of the fundamental at 2 kHz, the 3rd harmonic will depend on the level of the fundamental at 3 kHz and so on.
This follows a recommendation made by Steve F. Temme in "How to graph distortion measurements" presented at the 94th AES convention in March 1993. If the response of the system being measured is flat this makes no difference to the results, but when the response is not flat (as for most acoustic measurements) it can remove the influence of the loudspeaker's fundamental response from the distortion figures.
As an example, suppose the loudspeaker response was flat apart from a 6 dB peak at 2 kHz. 2 kHz is the 2nd harmonic of 1 kHz, so the 2nd harmonic level shown at 1 kHz will be increased by 6 dB due to the boost in the fundamental when using the excitation frequency as the reference. Similarly the 3rd harmonic level at 667 Hz (2/3 kHz) will be boosted by 6 dB. If the harmonic frequency were used as the reference the distortion figures would not show this boost.
Using the harmonic frequency as the reference also provides a more meaningful view of distortion at frequencies below the LF roll-off of the system as otherwise the distortion levels are boosted as the level of the fundamental drops. Note that this option will not affect the traces when the plot is not normalised, but will still affect the values in the legend if the distortion figures are set to read in percent or in dB relative to the fundamental.
Last edited:
Hey Dave, hope your doing better! 🙂
I am thank you. Many fro yesterday’s event can attest to seeing me hobble around unaided on hard even ground.
JohnPM created REW (..which I believe was used for those harmonic distortion sweep plots), and this is what he has to say about (..and is much better at explaining it than I):
Thanks for the links.
dave
LOL, thanks. I knew what it meant, and had wanted that option - but a lack of coffee forbid my brain from understanding it when I read it. 😀Look at the FR plot--that's why I posted it. The following from the help file:
"If the response of the system being measured is flat this makes no difference to the results, but when the response is not flat (as for most acoustic measurements) it can remove the influence of the loudspeaker's fundamental response from the distortion figures. "
That's the take away, right there.
OK, going back to the original post, Jon is asking two related questions.
Harmonic Waveform Generator :: Electronic Measurements
by playing with the harmonics and the waveforms. Try the same distortions, but at different fundamental frequencies. While this might not correlate directly to distorted music, it at least gives you a start to directly controlling it.
No, as least not as to their subjective effect. You can get an idea hereWell, for starters, is all octaves created equal, regarding audibility of harmonic distortion?
Harmonic Waveform Generator :: Electronic Measurements
by playing with the harmonics and the waveforms. Try the same distortions, but at different fundamental frequencies. While this might not correlate directly to distorted music, it at least gives you a start to directly controlling it.
How would you test that - either by ear or by measurement? How would you proceed? Perhaps take a good fullrange driver and measure and listen to it, then replace its bass and treble with a woofer and tweeter and find the differences.For what i understand, multi-way will help in that regards by dividing the tasks among drivers that are in their comfort zones. But to what extent?
..Perhaps take a good fullrange driver and measure and listen to it, then replace its bass and treble with a woofer and tweeter and find the differences.
Unless the surround does NOT stabilize/center the operation of the driver well, MOST of a driver's distortion centers around fundamental resonance. The exception is a surround "resonance" (which tends to occur somewhere between 900 Hz for large drivers up to 2.2 kHz for much smaller drivers).
A good way to select the pass-band for the driver is by looking at its impedance.
Here's the little 4 inch mid from SB:
http://www.zaphaudio.com/temp/SBAcoustics-SB12MNRX25-4-IMP-2.gif
A little above 200 Hz is a good high-pass area because it's right before the driver's impedance start's rising toward lower freq.s.
The driver has a surround "resonance" issue at around 1.6 kHz (..and it spans a wider freq. range than most drivers because of its very compliant surround). Still, it's unlikely you would limit a 4 inch mid to 1.6 kHz. 😱
Instead look to around 2.2-2.5 kHz (before the impedance starts rising much further from it's "resonant" range) as a more practical place for a low-pass area.
Analysis like this should give you a decent starting-point for the test for most cone drivers.
..IMD of course will be limited with a pass-band limiting filter.
Last edited:
- Status
- Not open for further replies.
- Home
- Loudspeakers
- Multi-Way
- Does multi-way reduce *audible* Harmonic Distortion ?