remove one baseband channel going to the modulator and see how much distortion power filled into the empty channel
I remember doing this on the 25KHz channel iDEN (Nextel, Clearnet....) phones. I got a DSP software guy to build me a test load with one of the four 6.25 KHz subcarriers turned off. I was the lead RF engineer on the first iDEN / GSM multimode phone. I got the idea to use a GSM RFPA with the bias turned up a bit for linearity in iDEN (four subcarriers of 16 or 64 QAM) mode. The dead subcarrier test proved that the "boosted" GaAs HBT GSM (from another vendor) PA was cleaner and cheaper than the LDMOS PA from Motorola that was used in the shipping phones.
At one time, I came up with the idea to create a special audio test signal.
An example signal would be a digitally modulated a 1 kHz tone "carrier" using 16 or 64 QPSK, with a symbol rate and baseband vector modulation filter to give an occupied "channel" from 900 Hz to 1.1 kHz. Then the signal was to be applied to an audio amp......Another way to make this test signal would be to do a band limited white noise.......I did not see any literature on doing this kind of test to an audio amp.
I did similar stuff (the old fashioned way, with multiple signal generators) when working with LTE RFPA's, but never thought of doing the same thing at audio. There is obviously a gap between how engineers test a HiFi amp, and what we hear. Much of the gap is created by marketing fluff like what's discussed in this thread, but there is still a real gap. I have seen too many examples firsthand (my hearing isn't good enough to resolve some of them) to know that THD, IMD and others don't paint the complete picture.
Now if I only knew a Matlab and Labview wizard that could come up with some WAV files to do the same thing at audio......
Subtract a scaled version of the amplifier output from the input signal (using any audio source) and listen to the difference (distortion). A nulling attenuator needed to minimize the residual. A high quality Op Amp to bring up the level of the distortion for headphones.
Some phase correction of the output needed at HF and LF, or else BW limit the signal difference.
Some phase correction of the output needed at HF and LF, or else BW limit the signal difference.
Last edited:
Miles Prower,
You are correct. I was thinking of an AM exciter that drove a linear RF amp; not the 250 Watt AM transmitter with class C RF amp at the local radio station when I was a kid.
Wavebourn,
If it was not a commercial prototype, I would have liked you to post the schematic of your:
High End Push-pull vacuum tube amplifier prototype, unique | eBay (Post # 81 above)
I remember the Heath 40 Watt CW transmitter that used the 6BQ6 in class c, the 6.3V version of the 12BQ6 you used in the above audio amp.
Did you ever publish the schematic of the audio amp?
Tubelab_com,
You had done RF amp testing with load line variations.
How about that concept modified for audio amplifiers.
A loudspeaker's impedances are often complex, and there are so many different models.
And how about a corner horn loudspeaker on a stand in the middle of the room, and another corner horn on the floor in the corner. Is one woofer not loaded, and the other loaded?
Is there a hit in the bit error rate test of a cell station when the Condor flies immediately in front of one sector's cell transmit antenna, I can only 'reflect on it'.
Last edited:
DF96,
I missed what you said earlier that was repeated by Miles Prower.
You both corrected me with the various requirements for AM modulation.
I missed what you said earlier that was repeated by Miles Prower.
You both corrected me with the various requirements for AM modulation.
I did like the bicycle analogy.
But now there was a bicycle with 200Lb wheels and tires.
Not very practical as a bicycle.
But it was even less practical to use it in the manner of a mono-cycle or uni-cycle.
It is possible to incorporate an input limiter in the chassis of a class A amplifier.
Whether it is SE or push pull, no tube will cut off.
And if it is an AB amp, or a B amp, it will also have more predictable performance.
I still prefer the old definitions, but with more information of the truth, not the unstated and misleading marketing use of the definitions.
How the hi fi amplifier is expected to be used should be stated, along with the specifications of distortion, power, frequency response, stability, and loudspeaker load.
Perhaps it would also be good to state the limitations when it is used by merely turning up the gain until it clips, or otherwise sounds obviously bad to all but the most tone deaf listeners, so that those who choose to use it that way know what to expect.
A guitar amplifier often has different expectations of usage.
How some of them are used in a distorted fashion of total mind bending loudness, etc., may or may not be something that I want to listen to, either in a live setting, or on a recording. But to each his own.
Imagine a car that has a turbo that functions only when the rpm is below 900. (Imagine.) Then they market the car as Turbocharged. Other car makers would scream and I bet that “false” advertising would get shut down.
OTOH, imagine a brand-X amplifier that operates in Class A up until 50W, and then transitions to class AB up to 100Wpc, before eventually clipping.
And a brand-Y amplifier that remains in Class A all the way up to its full rated output of... 50W, after which it just clips.
In what way shape or form would the brand-X amp amplifier be any "worse" or any less worthy of being marketed as a "50W class A amplifier" than the brand-Y amp?
Marco
Perhaps it would also be good to state the limitations when it is used by merely turning up the gain until it clips, or otherwise sounds obviously bad to all but the most tone deaf listeners, so that those who choose to use it that way know what to expect.
This whole discussion is not hitting the bullseye yet. The Class A/ Class AB distinction is not about the way the music will sound. It's not relevant unless the amp isn't well designed. In an AB amp both power levels should be the same SQ in the amp as the power transitions higher into cuttoff, if the amp is well engineered to minimize any crossover distortion. FB is the magic. The focus of attention should be on the difference between an SE and a PP amp. That is where the characteristics of distortion and PS ripple hum diverge, vis-a-vis. Both types sound great.
In what way shape or form would the brand-X amp amplifier be any "worse" or any less worthy of being marketed as a "50W class A amplifier" than the brand-Y amp?
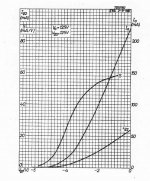
From the typical gm curves posted back in #53 (and 1st graph below), the fully overlapped conduction class A amplifier will tend to have near constant gm (sum) throughout the full operating range. While the partially overlapped conduction class AB amp will have almost constant gm (sum) up thru maybe 80% output (actually a slightly curved upward sum) until near the transition regions where gm will sharply round upward toward the V shaped gm regions of the class B portions. Sort of "anti-clipping".
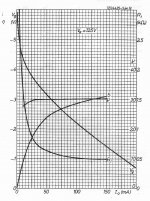
Of course N Fdbk can fix that. But may make the amplifier sound "flat", at least for some SE amp users. An optimum fix exists. Some tail resistance under the output tubes might "de-curve" the (central) gm (sum) too. (2nd graph below is tube gm over a CCS tail (ie, versus current), which has an opposite downward curvature sum in P-P. Some intermediate tail R can achieve a near flat (central) gm sum. It won't fix the V shape gm regions in the class B portions however. )
So a subtle difference if done well. A noticeable difference if done badly. Depends on the tube gm curve details and circuit design. Local output tube N Fdbks could change everything too.
As is apparent, a summed gm plot versus input signal, displayed on a scope, would be a big aid in developing correct output stages. Not that hard to make actually. A linear ramping input signal across the relevant range, with a summed small amplitude 1 KHz test signal. Then display the ramp on the scope horizontal, and a 1 KHz filtered and rectified/smoothed output amplitude on the scope vertical. Just a dynamic gm tester actually.
.
Attachments
Last edited:
Well, what do you want? A heater or a Class D amplifier?
I have built a guitar valve amplifier using two push pull EL84s that via a switch gives the VOX sound in pure class A which I do like as it sustains beautifully. Or switched to class AB for 'that' Marshall sound. It's up to you. But my vote is class AB with as the guru Nelson Pass says, the first watt should be pure class A.
I have built a guitar valve amplifier using two push pull EL84s that via a switch gives the VOX sound in pure class A which I do like as it sustains beautifully. Or switched to class AB for 'that' Marshall sound. It's up to you. But my vote is class AB with as the guru Nelson Pass says, the first watt should be pure class A.
I would be happy to settle for a well designed class AB amplifier. Using local output stage N Fdbks and moderate global N Fdbk.
If purchasing one, I would demand the gm sum "wing plot" be posted. (SS design books typically post these for different topologies) From that, one can tell if the amplifier is going to be ear grating (noticeable and many ripples in the gm wing plot) or smooth sounding (a flat wing plot, or at least smoothly varied gm for low harmonics). I would value this far above any THD specs.
If purchasing one, I would demand the gm sum "wing plot" be posted. (SS design books typically post these for different topologies) From that, one can tell if the amplifier is going to be ear grating (noticeable and many ripples in the gm wing plot) or smooth sounding (a flat wing plot, or at least smoothly varied gm for low harmonics). I would value this far above any THD specs.
you only need class A operation at the zero voltage point where the signal passes from the positive output transistor to the negative.
I biased my mosfet amp at 75ma. under load at 100khz it does not show any visible crossover distortion.
By using a heavy bias, the outputs are in a more linear range which may result in a THD reading of 0.0004% instead of 0.002% if your amp is designed for very low distortion.
In addition to low distortion, I want an amp that is also unity gain stable and ultra wideband.
this means usually a current feedback amplifier and alludes to smoking amp's wing plots as parasitic oscillation is very unlikely if the amp is unity gain stable.
Last edited:
That would be the case for a HIGH N Fdbk amplifier with very low distortion, but for (-some-) tube amps which have NO or LOW global N Fdbk, I would want to see the gm wing plot. To insure only low order harmonic distortion.
From the typical gm curves posted back in #53 (and 1st graph below), the fully overlapped conduction class A amplifier will tend to have near constant gm (sum) throughout the full operating range. While the partially overlapped conduction class AB amp will have almost constant gm (sum) up thru maybe 80% output (actually a slightly curved upward sum) until near the transition regions where gm will sharply round upward toward the V shaped gm regions of the class B portions. Sort of "anti-clipping".
I know I've discussed this with you in the past. This is a subject that interests me a lot.
I just printed out your E55L transconductance curves and just doodled some combined sum curves for a push-pull stage at 12mA, 15mA, 20mA, and 50mA bias points. I saw similar shapes to solid-state devices, although much smoother. The 12mA case was a smoothed V-shaped curve with perhaps 16mA/V total variation. The 15mA case gave a more flattened curve with a small peak emerging in the center of the "V". There was slightly less than 8mA/V total variation in that curve. The 20mA case gave a good strong peak in the center with rising sections on the left and right sides of the curve from the center (peak was over 6mA/V tall, which makes up the total variation in this case). The 50mA case was a large peak with all signs of the "V" gone. It had over 26mA/V variation in gm across a reasonable operational range. Overall, these shapes are very similar to what I've seen in textbooks for solid-state devices, although the shapes are much more rounded and smaller in magnitude.
Of course, this represents working into a vertical load line, but I'm thinking that gm would be pretty constant with plate voltage at a constant current, so this would give us insight into how a real push-pull output stage would work.
I'm puzzled that you state that the class A case has nearly constant gm, since that is where I saw the most variation. The cases where I saw the least variation in combined gm where when I biased right in the steepest part of the gm curve. Maybe I'm missing something here. I'll try to post my doodle later.
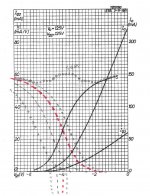
Are you using the gm curve that is versus grid voltage? (below)
You would certainly get a bump in the middle using the gm versus current curve. (which is what one gets over a CCS tail)
But normal P-P grounded cathode outputs use the gm versus Vg curve. (S shape) Since the two Vg are complementary there. (the anode currents are not so complementary due to a common mode component)
The plate voltage does not matter much for pentodes, so the gm versus Vg at a fixed Va graph is still useful.
For triodes however, the plate voltage variation is acting like N Fdbk to keep the gm variation fairly constant. So plate V does matter there.
Attachments

Last edited:
Are you using the gm curve that is versus grid voltage?
Yes, I picked a plate current (tied to a grid voltage on that plot) and centered things there. I plotted a point that is double the gm value at my center point. Then I summed the gm value of one square to the right and one square to the left and plotted that value on both sides of my center value. Then I repeated that moving outward from my centered point. Does that sound reasonable?
That would be the case for a HIGH N Fdbk amplifier with very low distortion, but for (-some-) tube amps which have NO or LOW global N Fdbk, I would want to see the gm wing plot. To insure only low order harmonic distortion.
Before SY left California, we tortured my Pyramid amp prototype with his setup and found that on 40W output (half of power) it was adding -80 dB of 2'Nd order only harmonic, the rest was below noise floor. On lower power distortions only went down. However, on powers above 40W the tail of harmonics grew up with output power.
I consider it an ideal behaviour of a power amp: zero distortions on close to zero power, <0.1% of low order distortions on half power, and soft clipping.
In further designs I was targeting similar result.
RE: SpreadSpectrum
That sounds like the correct way.
I just made a hasty summing graph(s) below, and I see a bump in the middle for the class A case also. Apparently the S curve is not perfectly symmetrical. Should make for an interesting set of graphs as the overlap conduction is reduced. (more neg. bias at center)
RE: Wavebourn
Sounds pretty good. How to convince the customer now?
That sounds like the correct way.
I just made a hasty summing graph(s) below, and I see a bump in the middle for the class A case also. Apparently the S curve is not perfectly symmetrical. Should make for an interesting set of graphs as the overlap conduction is reduced. (more neg. bias at center)
RE: Wavebourn
I consider it an ideal behaviour of a power amp: zero distortions on close to zero power, <0.1% of low order distortions on half power, and soft clipping.
Sounds pretty good. How to convince the customer now?
Attachments
Last edited:
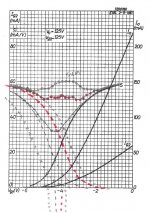
I did a couple more crude gm sums. Looks like just a little less overlap might get closer to constant gm.
Class AB is definitely developing a V shape.
Class AB is definitely developing a V shape.
Attachments
Last edited:
Sounds pretty good. How to convince the customer now?
Listening. To the sound, but never to gurus! 😀
This year on festival people said that the sound was perfect, and better than the last year.
But what was the real difference?
The real difference was, 2 more setups nearby. One with Yamaha speakers, another one with JBL speakers. People were kind of forced to compare and go to conclusion. 🙂
YouTube
Last edited:
- Status
- Not open for further replies.
- Home
- Amplifiers
- Tubes / Valves
- Definition of Class A?