The existing crossover of my speakers, Braun LS200, has 2nd-order topology. I’d like to convert it to 4th-order on woofer-midrange crossovers.
According to car components of the same brand, there are two versions of active crossovers: 642csi and 642ix. The specs are shown below:
642csi
85Hz low-pass @ 2nd-order Butterworth
170Hz hi-pass @ 2nd-order Butterworth
642ix
100Hz low-pass @ 4th-order Linkwitz-Riley
170Hz hi-pass @ 4th-order Linkwitz-Riley
1) I wonder that in order to apply conversion to my LS200 speakers, can I use the ratio of the 642 crossover series? Let’s say the 85Hz divided by 100Hz obtained a factor of 0.85. If, for example, my LS200’s woofers are crossed at 270Hz @ 2nd-order, applying 0.85 factor to 270Hz would yield about 320Hz. The 320Hz be a cut-off frequency of the 4th-order system, shouldn’t it?
2) The original woofer-midrange crossover of the LS200 speakers are 2nd-order and WITHOUT reversing midrange polarity. After converting to 4th-order, does it require to reverse polarity of one driver, either midrange or woofer? Because the 2nd-order and 4th-order system have phase difference about 180 degrees to each other.
2) Reverse.
Speculating of course, but if the drivers are adding to the 2nd order to make 4th and you have no reversal.. then 4th would add with the drivers to make 6th and you want reversal.
Speculating of course, but if the drivers are adding to the 2nd order to make 4th and you have no reversal.. then 4th would add with the drivers to make 6th and you want reversal.
Of course, you could be right, AllenB, but it doesn't say if the woofer is reversed, only that the midrange is not reversed (as of now).
The original woofer-midrange crossover of the LS200 speakers are 2nd-order and WITHOUT reversing midrange polarity. After converting to 4th-order, does it require to reverse polarity of one driver, either midrange or woofer? Because the 2nd-order and 4th-order system have phase difference about 180 degrees to each other.
Ah, you could be right 😉 .. Or maybe it doesn't say whether it's reversed but want's to know if it needs to be further reversed..??
I didn't answer 1 because it would be better to know the driver responses. It would perhaps be quicker to try it and measure the total and try both polarities.
I guess these two cases have the same HP polarity, don’t they?
Could you plot the simulation graphs again, but they have opposite polarity in each case? i.e., the 2nd order has non-inverted HP, whereas the 4th order has inverted HP. TIA
Could you plot the simulation graphs again, but they have opposite polarity in each case? i.e., the 2nd order has non-inverted HP, whereas the 4th order has inverted HP. TIA
Last edited by a moderator:
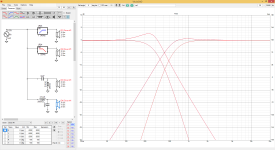
Hi, it takes about 30 seconds to hook up a test setup with ideal drivers in VituixCAD to play around with and get intuition how it works out.
1. open VituixCAD
2. copy paste the driver there is
3. hookup the circuit, high and low pass filters and a delay block if you wish. Ideal tweeter and woofer.
4. play around. Flip polarity of a driver right clicking it and choosing invert. Or just use CTRL+I
Same thing in pictures


Bonus: to get it more realistic, change Y coordinate of the woofer for example to -150mm or what ever. Make simplified ideal spinoramas with ideal drivers in diffraction tool to include some baffle edge diffraction effect, or what ever you fancy, inspect power response, estimated in-room response, horizontal and vertical pattern, what ever😉
Task, can you make a perfect speaker for your room and to your liking with these simplified sims using ideal drivers? should be easy, right? 🤓 It could, but only if you knew what to target for: what sound you like, how the room affects and how does the perceived sound look like as graphs!
1. open VituixCAD
2. copy paste the driver there is
3. hookup the circuit, high and low pass filters and a delay block if you wish. Ideal tweeter and woofer.
4. play around. Flip polarity of a driver right clicking it and choosing invert. Or just use CTRL+I
Same thing in pictures
Bonus: to get it more realistic, change Y coordinate of the woofer for example to -150mm or what ever. Make simplified ideal spinoramas with ideal drivers in diffraction tool to include some baffle edge diffraction effect, or what ever you fancy, inspect power response, estimated in-room response, horizontal and vertical pattern, what ever😉
Task, can you make a perfect speaker for your room and to your liking with these simplified sims using ideal drivers? should be easy, right? 🤓 It could, but only if you knew what to target for: what sound you like, how the room affects and how does the perceived sound look like as graphs!
Last edited:

Hi tmuikku,
I've tried VituixCAD as your suggestion. I created 2 systems; D1 & D2 drivers are active system, and D3 & D4 drivers are passive.
However, I have some problems and I need your help.
1. How to change colour of each line?
2. How can I change the impedance of the drivers in the passive system: D3 and D4?
3. Can the program shows total FR of active and passive systems simultaneously?
Actually, I usually use XSim program in passive crossover design, but I'm not sure if the XSim could do the active system.
Attachments
Last edited:
You might go to the drivers tab and create others as they each have different colours.
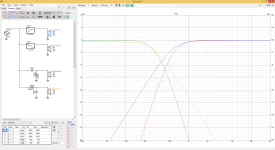
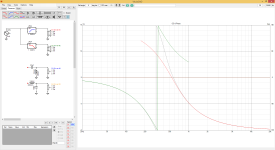
I had successfully simulated the active system and divided it into two scenarios: reversing one driver and not reversing one driver. I then concentrated on the phase plots.
I thought the graphs were odd.
Could anyone please assist me in interpreting the graphs?
I thought the graphs were odd.
Could anyone please assist me in interpreting the graphs?
Attachments

Hi, not sure what you want to have comment for? the phase lines are cut where response drops below some threshold. I guess this is something kimmosto has set in the system, to reduce clutter in the graphs.
You can read phase difference between the drivers at some frequency by inspecting what their spacing is. Take 500Hz for example, and see how many degrees there is between green and red lines. Hard to read? yeah, manipulate the system so its easier, flip polarity of both drivers for a second 😉 or, add a gain/delay block before you split the signal for filters and have that polarity reversed instead. You could add delay with it if you wanted, just to read the graph better. Of course you would not need/put it on real speaker. The phase varies continuously, but since the graph shows +/-180deg the line just wraps around from top to bottom, or vice versa, and you can use the above tricks just to move where the wrap happens so you can read the graph better. If the graph showed like +-360deg or more there would not be such wrap. But yeah its just how the graph is plotted.
Usually you would want the phase traces of the ways overlap around crossover frequency so audio from each on the overlapping bandwidth is in same phase. If they are not, their interference changes to various directions and frequency, which might be wanted feature on some occasion.
You can just play with it and reason with what you see on the graphs, try to relate what you see on various things you've read on books or on the forum. Play with it, see what affects what, and how it relates to real world speakers, and how would it sound 🙂
Last edited:
To change impedance you must load impedance for the driver(s), on the drivers tab, below where you can add frequency responses.
In real project, you should measure real impedance and frequency response from the system you have built to make accurate simulation of the real deal. But playing with the program to educate yourself like this you could generate response and impedance in the Enclosure tool. Spinorama measurements can be made with the Diffraction tool. You could also trace FR and impedance fron driver datasheet.
In real project, you should measure real impedance and frequency response from the system you have built to make accurate simulation of the real deal. But playing with the program to educate yourself like this you could generate response and impedance in the Enclosure tool. Spinorama measurements can be made with the Diffraction tool. You could also trace FR and impedance fron driver datasheet.
Try unwrapping the phase plots.I thought the graphs were odd.
Here is how'd one can whip up "ideal" concept with spinorama data with the diffraction tool.
Diffraction tool spits out "measured" frequency response files just like ARTA or REW would if you follow VituixCAD measurement manual while measuring a real speaker. Instead here we are measuring ideal and simplified system.
This is very powerful thing to play with, ideal drivers on simplified ideal baffle. You can inspect various things with it, what ever you are interested in in very short time and in real time. Use mouse wheel to scroll some value, like y-coordinate of woofer to see how c-c distance affects things for example. Or change observation angle to see how the phase matching and polar maps relate and so on 😉 what ever feels interesting to you. Experiment with interference, filters, "beaming", edge diffraction, what ever.
1. As VituixCAD opens connect the driver to source and open diffraction tool

2. Set some baffle dimensions you want to simulate. Set driver size, for example a tweeter. Hit "New".

3. Move the transducer to it's place, and move the mic to listening axis. Check "Feed speaker" checkbox and click Export to have the measurements set to the driver in main program. You could save it if you want to edit it later. Don't close the diffraction tool window yet.

4. Now you'd see ideal flat disk tweeter on simple baffle with approximation of response all around. It doesn't include effects of back of the box or cone resonances or shape of cone, but something nevertheless, baffle step and beaming and front edge diffraction.

5. Now main program drivers tab add another driver as woofer, leave it selected as blue. Diffraction window still open so the same baffle there, change the transducer dimension to a woofer and move it to position, no need to hit new, just click "export" and ideal woofer measurements appear for the selected driver.

6. now just hook it all up, adjust as you wish to get insight how to make real speakers behave, how the graphs relate to physical dimensions and so on 😉

On this example I left the microphone at listening height and spun the woofer responses with the same mic position as the tweeter responses. This means coordinates are left to 0 in the main program. If you moved the mic, measured each speaker at their axis like it is suggested in measurement manual, then you should reflect the mic position with the driver coordinates in main program. This all is in the measurement manual. There is no need to process the measurements in anyway as they are already pristine without room reflections.
Ok, now you have it setup just play with the DSP filters, no need to use passives here. You can always use passive filters when you actually build it and have real data, and real impedance measurements. It takes about 2 minutes to whip up something like this. You are able to learn a ton while zipping coffee when you get some routine with it. Use imagination to come up with tests on things you want to learn more about.
Have fun!🙂
Diffraction tool spits out "measured" frequency response files just like ARTA or REW would if you follow VituixCAD measurement manual while measuring a real speaker. Instead here we are measuring ideal and simplified system.
This is very powerful thing to play with, ideal drivers on simplified ideal baffle. You can inspect various things with it, what ever you are interested in in very short time and in real time. Use mouse wheel to scroll some value, like y-coordinate of woofer to see how c-c distance affects things for example. Or change observation angle to see how the phase matching and polar maps relate and so on 😉 what ever feels interesting to you. Experiment with interference, filters, "beaming", edge diffraction, what ever.
1. As VituixCAD opens connect the driver to source and open diffraction tool
2. Set some baffle dimensions you want to simulate. Set driver size, for example a tweeter. Hit "New".
3. Move the transducer to it's place, and move the mic to listening axis. Check "Feed speaker" checkbox and click Export to have the measurements set to the driver in main program. You could save it if you want to edit it later. Don't close the diffraction tool window yet.
4. Now you'd see ideal flat disk tweeter on simple baffle with approximation of response all around. It doesn't include effects of back of the box or cone resonances or shape of cone, but something nevertheless, baffle step and beaming and front edge diffraction.
5. Now main program drivers tab add another driver as woofer, leave it selected as blue. Diffraction window still open so the same baffle there, change the transducer dimension to a woofer and move it to position, no need to hit new, just click "export" and ideal woofer measurements appear for the selected driver.
6. now just hook it all up, adjust as you wish to get insight how to make real speakers behave, how the graphs relate to physical dimensions and so on 😉
On this example I left the microphone at listening height and spun the woofer responses with the same mic position as the tweeter responses. This means coordinates are left to 0 in the main program. If you moved the mic, measured each speaker at their axis like it is suggested in measurement manual, then you should reflect the mic position with the driver coordinates in main program. This all is in the measurement manual. There is no need to process the measurements in anyway as they are already pristine without room reflections.
Ok, now you have it setup just play with the DSP filters, no need to use passives here. You can always use passive filters when you actually build it and have real data, and real impedance measurements. It takes about 2 minutes to whip up something like this. You are able to learn a ton while zipping coffee when you get some routine with it. Use imagination to come up with tests on things you want to learn more about.
Have fun!🙂
Last edited:
- Home
- Loudspeakers
- Multi-Way
- Converting 2nd-order to 4th-order system