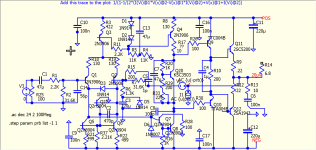
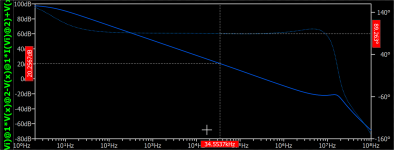
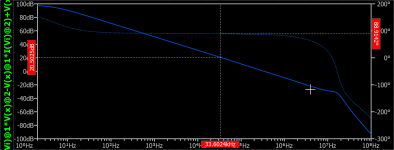
I wish to learn how to interpret BODE plots to determine which trans to select - KSA 1015/1815 (green plot) or 2N4401/4403 (red plot).
What positive and what can be seen in each. Does one indicate it might be the more stable? The 2N4401 has lowest THD but higher voltage noise spec. Wondering which to buy...

What positive and what can be seen in each. Does one indicate it might be the more stable? The 2N4401 has lowest THD but higher voltage noise spec. Wondering which to buy...

Sorry, I forgot to add this schematic; D Self's Blameless
I generated the Spice Bode plots with 28Volts
Tail current 1.5mA
NFB cap 15p

I generated the Spice Bode plots with 28Volts
Tail current 1.5mA
NFB cap 15p
If the output noise is at an inaudible level there's no reason to not use 2N4401's. However, your plots suggest that the THD differences become less and less as frequency goes up; and they probably aren't significantly different @1KHz. The OLG's are pretty similar there (I assume that's what your plots are showing since 20log(20) is about 26 dB).
I think it's likely that the different devices have different Va's but similar Ccb's so their performance (in terms of OLG) decrease as frequency increases.
Maybe you're splitting hairs?
On the other hand, perhaps you can get more closely-matched devices for one P/N vs. the other. That definitely would be a deciding factor for me.
If the plots are loop gain plots, then the amplifier has very little (if any) gain margin and may well become an oscillator.
If the plots are open-loop gain plots, then the amplifier runs out of loop gain around 20 kHz, so you will have some treble loss and poor distortion performance at high audio frequencies.
In either case, TR12 may dissipate excessive power when the output clips to the negative rail.
How exactly did you simulate those Bode plots? Is there a loop gain probe somewhere and if so, where?
Last edited:
@Mark'51 Thanks for the prompt, discovered KSA994/1845 match tighter (<2uA ) compared to others(<7uA)
@MarcelvdG Thanks. For CLG a probe is placed in the NFB loop to TR3; OLG V_out measurers 28dB. I observe that B Cordell adds a R100 to Grd after TR12 plus flying catch diodes between VAS outputs. Might this alleviate clipping issue?
Thanks for the opportunity to learn, I'm very much a beginner. Both tests used 15pF cap followed with R220 around R8 and what I have since discovered is the elevation of the plot on left Log scale moves according to the R value.
2N case - R100 plot level rises by 20dB; KSA case - R332 plot level rises by 10dB. Has this any useful meaning?
A second observation is removing the R/C filter around R8, whilst adding 56pF cap at the IPS, flattens the plot at 85 Degrees to 380kHz measured at Log O_dB with OLG 28dB. Is this useful to do and does this show a corner frequency? Do I need to eliminate the rise beyond the audible band?
The schematic helps, but you didn't say in which positions those transistors go (we can speculate, but it's better if you confirm) and which transistors go in the remaining places.
Also, before you can reasonably trust a stability simulation, job #1 is to make sure that all transistor models you're using model fT reasonably well. Find fT vs. Ic plots in the datasheets and compare to the simulated ones, then tweak the models if necessary.
Also, before you can reasonably trust a stability simulation, job #1 is to make sure that all transistor models you're using model fT reasonably well. Find fT vs. Ic plots in the datasheets and compare to the simulated ones, then tweak the models if necessary.
A diode in parallel with C3 can solve the clipping issue, cathode to TR4's collector, anode to TR12's base. It has to be a diode that can handle a substantial reverse voltage, as it gets almost the full voltage between the positive and the negative rails across it during positive peaks, and it should have a reasonably low capacitance.
@cabirio @mlloyd1
I replaced Self's preferred NPN and PNP in the IPS and VAS only to do two tests using the complementary tran parts listed in initial post. I have two results and, not being experienced enough to interpret the result, I wanted to learn some more. Cabirio kindly helped me to configure Bode plot test last month in another thread.
Learning to tweak models after simulating ft and Ic is something I'd like to learn about after I chose a tran part to stick with. Tweaking models after learning to interpret the information revealed in CLG Bode plot sounds right to me (sneaky pun).
Last edited:
Update: 2N3904/6 pair match better with 2uA difference across LTP current mirror with the buffer trans added. C5 with 1pF cap gives a flat response and removed a gentle curve after 1MHz; does the 1pF cap serve a useful purpose when the buffer has a 470pF cap?
My initial post was to learn about Bode plot in relation to audio. My recent measurement shows the phase rising at low frequency, can I ignore this? It rises less without C5. Not in the scope of the original post I'm wondering why Self uses R17- everything measures the same with and without.
Cheers
My initial post was to learn about Bode plot in relation to audio. My recent measurement shows the phase rising at low frequency, can I ignore this? It rises less without C5. Not in the scope of the original post I'm wondering why Self uses R17- everything measures the same with and without.
Cheers
Attachments
I assume R17 in your schematic corresponds to R14 in D. Self's? Then it's in the wrong place, look carefully. As for its purpose, you can read all about it e.g. here:
Hello all,
Wondering if anyone has done tests to optimize the value of current compensation resistor (R39 on the attached schematic) to minimize the shift in amplifier bias setting with changes in the +B supply rail voltage. If so, what results were obtained.
I just ran a real world test on various values of resistor ( 0 to 91ohms) and found the optimal value to be 36ohms, which is much higher than the conventionally suggested value of about 13ohms for the 10mA VAS current being used. Interestingly this agrees with the optimal value which my LTSpice simulations predicted while...
- mikebeth
- Replies: 63
- Forum: Solid State
- Home
- Amplifiers
- Solid State
- BODE plot KSA1015 / 2N4402 comparison and question