Now using a simple difference amp for getting rid of the 1 ohm error. The 25K resistors must be within 1%. Such resistors are about 1000x bigger than the impedance they connect. Their loading effect can be neglected.
True differential amp are thus not required.
A chip like the INA134 is inexpensive, this is a dedicated simple difference amplifier, and it has the high-precision 25K resitors built-in.
For the two INA134, I'm using a symetric power supply made of two 9V batteries. Not represented on the schematic.
Using a second simple difference amp for measuring the voltage drop on the 1 ohm resistor has a great advantage. This way there is no ground loop forming with the signal ground (the ground coming out the PC) and the power ground (the negative speaker out terminal coming out of the power amplifier).
Attachments
-
Z measurement for TS parameters.zip753 KB · Views: 47
-
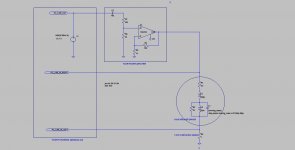 Z measurement (basic) (schema).jpg55.6 KB · Views: 130
 -
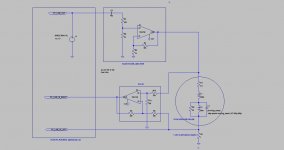 Z measurement (simple difference amp) (schema).jpg68.8 KB · Views: 123
 -
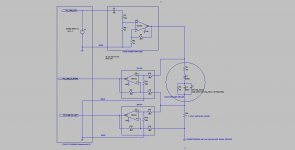 Z measurement (dual simple difference amp) (schema).jpg67.3 KB · Views: 132
 -
 Z measurement (basic) (curve).jpg174.3 KB · Views: 122
 -
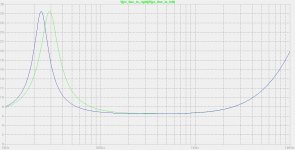 Z measurement (simple difference amp) (curve).jpg174.9 KB · Views: 119
 -
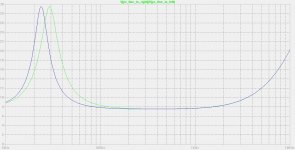
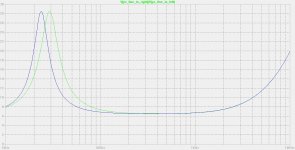 Z measurement (dual simple difference amp) (curve).jpg174.8 KB · Views: 57
 -
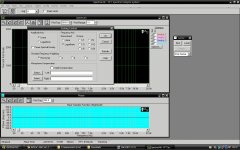 Z measurement (SpectraLab 4.32 screen) (linear Y scaling).jpg208.1 KB · Views: 53
Last edited:
First I would like to thank you Steph for all your efforts for trying to educate me, and doing all the examples.
Regarding SpectraLab, I've downloaded it with the help of your links. However, the company seems to be quite dead. I have not heard anything in weeks in response to my inquiry. Unfortunately for me, I've a huge problem with using software with uncertain licence issues, and there is no sign that the SpectraLab is abandonware.
I've therefore tried to search for usable software for my platform of choice, and found "baudline" baudline signal analyzer - FFT spectrogram
It seems to be able to do many things, but if it can perform the dual-channel measurements I'm still trying to figure out, and I'm still waiting for answers to my questions on this subject posted at their message board.
If anyone with greater knowledge than me could take a look and see if it can perform the dual-channel measurement needed? I believe it does, but I would like to be 120% surtain before I start out trying to learn a new software. I just hope it will support my sound card.
It's free, and awailable for at least Linux, Solaris and Mac OS X. Sorry, no Windows in any near future as I understand it.
This is my concern also. I never got a quote from them. And I still don't know if reinstalling the computer is permitted. Must say that as an occasional hobbyist, I'm using SpectraLab 4.32 trial version very intermittently. Maybe 60 days in 10 years. I'm maybe compliant with the spirit of the SpectraLab 4.32 temporary 30-days licence. SpectraLab is a great piece of software. It makes you understand what you are measuring. I will always recommend it. I'm taking the opportunity here to ask a question : how to interface a P-P probe or a P-U probe for measuring the sound intensity instead of the sound pressure ? In 2011, I'd like to measure speaker drivers and loudspeakers using the sound intensity paradigm. I'm interested in knowing the shape of the wavefront. I'm interested in measuring the reactive component of sound for better understanding how two sound sources do blend and how the resulting wavefront propagates. I'm interested in visualizing reflexions, refractions and vortexes at various frequencies. Could be done using SynthMaker or DSP Robotics FlowStone driving a robot arm ? Anyone interested in this ? Currently, I have done an application for SynthMaker, kind of homemade SpectraLab, but I have issues synchronizing the two sample buffers in SynthMaker.Regarding SpectraLab, I've downloaded it with the help of your links. However, the company seems to be quite dead. I have not heard anything in weeks in response to my inquiry. Unfortunately for me, I've a huge problem with using software with uncertain licence issues, and there is no sign that the SpectraLab is abandonware.
Last edited:
Back again, final time???
I just wanted to tell that I finally? is back on track after having conquered my private daemons and a few others.
I'm doing my best with Basta! and right now I'm trying some math for calculating T/S parameters from an impedance curve as there are some strange results, and the published data for the driver in question look very odd in my eyes, and math is not my strongest subject. Will try to solve the issue during the weekend. One day left..............
How do you measure Vas on a tweeter that is encapsulated?
Now I have to go to work.
hi buggsson, if math is not your strongest subject, you could rewrite the simulations at post #121, using the physical parameters model instead of the electrical model.
Then, having measured the impedance curve, all you would need is to tweak the (R_coil, L_coil, BL, mass, compliance, losses, surface) physical parameters for getting a simulated impedance curve, the same as the measured impedance curve.
Then, having determined the values of the physical parameters, you would use standard formulas in Excel for calculating the T/S parameters.
Such is my preferred method, very robust. While doing this, you have the satisfaction to see how good the model fits the reality. This delivers a confidence level attached to the physical values and to the T/S parameters you are going to base on.
This way, as an example, you will know if the L_coil value given by the speaker manufacturer is providing the measured impedance raise above 5 kHz. If there is any mismatch, you need to ask yourself why the manufacturer is specifying a L_coil value that doesn't fit the measured impedance raise at high frequency. Then you know the frequency limit of the modelization.
Must say that if you know the formulas for transforming the electrical parameters model into the T/S parameters, you could use the simulations at post #121, directly, in the same curve-fitting process.
Last edited:
How do you measure Vas on a tweeter that is encapsulated?
Don't. Just make your crossover. It will be better if you have your own impedance and frequency response measurements to use.
If this is not on the cards and you intend to tweak by ear, you may be able to start with a published crossover for the tweeter.
hi buggsson, if math is not your strongest subject, you could rewrite the simulations at post #121, using the physical parameters model instead of the electrical model.
Then, having determined the values of the physical parameters, you would use standard formulas in Excel for calculating the T/S parameters.
I think that I now know enough to do the calculations using a lab exercise based on D'Appolito's book. The only drawback is that I won't be able to calculate Mms then I don't have access to a driver. It is the intended number one bass driver for my project, and I want some simulations to see how it fit the rest of the system (that I have, but still unmeasured).
I cannot see the the whole impedance curve, published Re value is 3.5 and the curve starts at 5.0, is that of any importance?
Since my days in science, I don't use Excel for calculations, I don't dare to.
Don't. Just make your crossover. It will be better if you have your own impedance and frequency response measurements to use.
OK, great to know. I will have my own measurements in due time.......
I forgot that I also have a frequency resp. curve. Any ideas of how many data points as a minimum for the impedance and frequency curves?
The measurement mic.
I will buy a measurement mic then it's gonna be cheaper in the short run then building my own since I need soldering station, etc, etc.
I'm considering one of the following two if one receives individual calibration files, or I might buy the service, I've not been able to find a calibration service near to where I live.
One has a larger dynamic range but much lower sensitivity and vice versa. Input very appreciated.
iSEMcon GmbH
iSEMcon GmbH
Any ideas of how many data points as a minimum for the impedance and frequency curves?
(4 curves, frequency response, acoustic phase, impedance magnitude, impedance phase)
I currently use 256 points to cover the spectrum. In the past I have used 64 points with some success.
(4 curves, frequency response, acoustic phase, impedance magnitude, impedance phase)
I currently use 256 points to cover the spectrum. In the past I have used 64 points with some success.
Then I'll be alright, I've got plenty of points. I'm looking forward to compare the Le model to my curves to see how it turns out.
Do I have a problem?
It has occurred to me that the impedance on my impedance vs. frequency curve is expressed on a logarithmic scale, according to the Basta! manual it is supposed to be expressed on a linear scale. This does that also the phase of this impedance curve is expressed on a logarithmic scale.
The SPL vs. frequency curve looks more like it, if I've got it right finally.
I have not used Basta, but as long as the software you use accepts the impedance properly, then you'll be OK. When using crossover simulation software, as important as it is to the software I don't find myself actually looking at the impedance much. I'll look at the impedance magnitude only when I'm guessing values to use and estimating amplifier loads. I'll also look at the phase when designing impedance conjugate circuits to flatten the impedance for a high output impedance amplifier.
If you are trying to trace a linear curve to produce an FRD file, you could act as if it is an SPL trace because dBs are expressed linearly.
If you are trying to trace a linear curve to produce an FRD file, you could act as if it is an SPL trace because dBs are expressed linearly.
"A fractal is a rough or fragmented geometric shape that can be split into parts, each of which is (at least approximately) a reduced-size copy of the whole."
Hey, buggsson, are you a fractal maybe ? Or an alien wanting to get the whole human science exposed on diyAudio ?
If you intend getting the sound reproduced at the full resolution and exactitude, and this means amplitude accuracy and phase accuracy also, and if you target a true 24-bit resolution and precision from 5 Hz to 48 kHz (96 kHz sampling frequency), then you need to graph everything using 16,777,216 points in linear frequency progression, and design and process everything using a precision of at least 24 bits in fixed points everywhere, using a decent rounding scheme, and adding some dither maybe.
Knowing this, you need to calculate what will be the errors if you are using less points in the graphs. You need to determine the maximum error you are willing to tolerate (I guess this will be your next question), and ultimately, calculate how many points you need to graph, and if it is more efficient to get them linear spaced in frequency, or log spaced in frequency.
We are stupid humans. We are so lazy that usually, we graph using 10 points per octave, or sometimes 100 points per octave if we want to "be sure", without knowing that we actually need 16,777,216 points in linear frequency progression. And we are so stupid that we are calculating everything using a 32-bit floating point, 64-bit floating point, or 80-bit floating point representation, all lacking commutativity, inside our personal computers, and still dare to think we may get something useful out of our loudspeakers. That's very bizarre. What is the catch ?
Cheers ! Have a nice week.
Last edited:
Ha! that was great, Steph.
Not wanting to torture poor Buggsson (lol), I'll offer an opinion on resolution. With regards to amplitude/SPL, I am very happy to get a +/- 0.5dB end result. Even +/- 1dB is excellent, and considering the usual range of errors, it is practically the best we can hope for. Even +/- 2dB is a very good result. That said, if my data were accidentally randomised by +/- 0.25dB in a catastrophic accident with the space/time continuum, I doubt I'd lose too much sleep.
With regards to frequency resolution: When you take a clean (reflection free) plot of your speakers, there aren't usually any very high Q issues within the passbands, and the smoother the responses are, the less resolution you require (up to a point) to successfully capture the shape of the curves. Furthermore, the crossed over curves are intended to be smooth too. It may be important to see your response at a very high resolution when integrating with a room, but this is crossover software we are talking about. Even if there was a very high Q spike somewhere and I decided to live with it, I'd ignore it's properties for the purposes of designing a crossover.
Well, I'd be happy to use any resolution available when I do my own measurements, but I'm only using a provided curve that I thought that I would use in Basta! that has a model for comparing measured impedance with that model, and I have not understood how that is supposed to work, yet. So if I am to use the curve I have (only the curve, no data points, I have to do my own) they cannot be that many. The curve, to me is quite strange, the Zmax centre, and thereby the Fs, lies 25% off from the published Fs value, and from another measured impedance curve on the product sheet. I guess I'll give the swedish distributor a call instead to see what can be solved. Using this curve for T/S parameter calculations would produce quite different data than the published.
Regarding the microphones, no input so far. My main issue is sensitivity vs. SPL. One is 40mV and >125dB, the other is 4mV and >140dB. I know sensitivity is nice, but which one would be better from a DIY perspective? Is for example 125dB enough for SPL-measurements? Apart from this, I think they are quite alike.
Thank you, I will try to have a nice week, although it is just work, work, work😀
Hi AllenB, you are using dangerous words like "usual range of errors", "practically", "room". I guess buggsson is now hard working, trying to quantify all this. You'll make him lose sleep. And you may also lose sleep, discovering too late that is was mandatory to quantify all those effects prior exploiting any measurement data. Don't worry too much, I'm joking. Or not maybe ?
Next questions shall be :
1) What is the recommended burn-in duration for a speaker, and what is the recommended signal to be applied on the speaker during the burn-in, for getting stable T/S parameters instead of the evanescent T/S parameters you may get upon unboxing the speaker ?
2) If we are measuring everything using a very very long FFT, taking much stimulation time, don't we face the danger that the loudspeaker is actually changing his T/S parameters during the measurement process, because of getting older ?
3) Regarding a SPL measurement, what is the room effect ? What is the magnitude of the room effect ? How to calculate this ? Do I need to know the Sabine coeffecients at 16,777,216 different frequencies, with a 24-bit precision ? Do I need to deconvoluate the room for isolating the pure loudspeaker response ? How to do this ?
4) Regarding a SPL measurement, is there a kind of Fletcher-Munson correction to be applied for ensuring that the mike won't saturate at the lowest and at the highest frequencies, far away from the 1 kHz sensitivity figure ?
5) What SPL should I use for graphing a loudspeaker Bode plot ? Can I set the SPL depending on my listening habits (loud or quiet) ? Shall I make five Bode plots, one at 70 dB SPL, one at 80 db SPL, one at 90 dB SPL, one at 100 dB SPL and one at 110 dB SPL ? I think I really need the 100 dB SPL curve because I like strong deep basses, and this looks like a Fletcher-Munson compensation. But I realize that very few speakers can deliver 110 dB SPL below 60 Hz. They saturate. What to do if all those curves don't run parallel in amplitude and if they are not surimposed in phase ? How many dB and how many degrees discrepancy are considered to be pathologic ?
Last edited:
Perhaps this isn't essential?Basta! that has a model for comparing measured impedance with that model,
you could try the SPL tracer at FRD ConsortiumI have to do my own) they cannot be that many.
You can either use the published T/S data and get close, which is often good enough, or break in your driver with some hours/days of excursion and measure the T/S yourself.Using this curve for T/S parameter calculations would produce quite different data than the published.
Response flatness is probably more important. You don't necessarily need high levels to take measurements. Freedom from reflections and from noise is more important.Regarding the microphones, no input so far. My main issue is sensitivity vs. SPL.
So, do you disagree?Hi AllenB, you are using dangerous words like "usual range of errors", "practically",
hi AllenB, I just want to make some fun, playing the same game buggsson is playing with us. Initially, trying getting everything quantified by hard science looked like a good idea. After a few iterations, we discovered that such attitude makes you go backwards 10 steps, after attempting making 1 step forward. The problem is that once you take such profile you need to stick with it forever, in everything. I just wanted to illustrate how far this can lead to unproductivity. Each time you need to take a measurement comes the question of the enviromental effects, calibration, interpretation. You want to diy-build a loudspeaker in your kitchen, but just after turning your voltmeter on, you find yourself like a rocket scientist needing to solve the Heisenberg uncertainty principle, and uncover the nature of quarks, gluons and possibly Klingons also.
And still all of us need to remember that, even if a piece of software can display a nice result or a nice curve, appearing as "the definitive answer", this is not "the reality", but some unperfect input data being processed by a program, written by a programmer, having understood or not having understood the essence of the underlying algorithm, that was perfectly applicable or less perfecly applicable to the situation.
And still all of us need to remember that, even if a piece of software can display a nice result or a nice curve, appearing as "the definitive answer", this is not "the reality", but some unperfect input data being processed by a program, written by a programmer, having understood or not having understood the essence of the underlying algorithm, that was perfectly applicable or less perfecly applicable to the situation.
Last edited:
- Status
- Not open for further replies.
- Home
- Loudspeakers
- Multi-Way
- Before I start out, I need some direction