Hi,
this is my first post here and I'm a beginner with building cabs even though I already built some cab with encouraging results.
Before telling you my problem, I would like to explane what I want to do.
Since I play the bass guitar, I would like to build a 2x10" bass cab (vented box) to use alone but also coupled with my 1x15" (600 Watt RMS @ 8 ohm) Parsek (now known as MarkBass) to extend the mid freq. response of the 1x15".
The 2x10" cab will have a total impedance of 8 ohm that, coupled with the 1x15", give a resulting impedance of 4 ohm (my amp head is a 400 Watt RMS @ 4 ohm, it can't go down to 2 ohm).
As designing software I'm using BassBox Pro 6 with the latest update and the speaker that I thought to use is the B&C 10NW64 (16 ohm version) connected in parallel (thus 8 ohm total impedance).
I've chosen that speaker because it has a high XMax (if compared with other 10") and I play a 5 strings bass (that can go low to 30 Hz playing the Low B) but simulating the response of the cab (@ 400 Watt) I found some confusing result.
Parameters of the calculated box are (rounded valuse):
Vb=65 liters
Fb=53 Hz
QL=7
F3=54 Hz
FIll=minimal
No. of Vents=2
Dv= 100 mm (calculated pressing the "Suggest minimum vent area for XMax")
Lv= 133 mm
Box measures (external)= W 600, H 400, D 400 mm
Wall Thickness= 18 mm
Maximum Cone displacement 8 mm @ 38 Hz
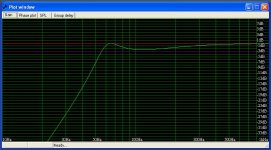
If I plot the "Normalize Amplitude Response" the F3 is not at 53 Hz as calculated by the program but around at 120 Hz !
And then all frequencies below 232 Hz are below to 0 dB !
So...a cab like this would be unusable for me.
Why this difference between calculated F3 and the "plotted" F3?
I would like to use this cab also as standalone (not coupled with the 1x15") when I have gigs into small pubs so it should have a good response around 30 to 2000 Hz (it will have a tweeter to extend the response up to 18/20 Khz).
Is it something possible with a 2x10" to get close to an "audible" 30 Hz? Or this is just a dream...
Regards,
Roberto
PS: sorry in advance for my english, I'm not english mother tongue.
this is my first post here and I'm a beginner with building cabs even though I already built some cab with encouraging results.
Before telling you my problem, I would like to explane what I want to do.
Since I play the bass guitar, I would like to build a 2x10" bass cab (vented box) to use alone but also coupled with my 1x15" (600 Watt RMS @ 8 ohm) Parsek (now known as MarkBass) to extend the mid freq. response of the 1x15".
The 2x10" cab will have a total impedance of 8 ohm that, coupled with the 1x15", give a resulting impedance of 4 ohm (my amp head is a 400 Watt RMS @ 4 ohm, it can't go down to 2 ohm).
As designing software I'm using BassBox Pro 6 with the latest update and the speaker that I thought to use is the B&C 10NW64 (16 ohm version) connected in parallel (thus 8 ohm total impedance).
I've chosen that speaker because it has a high XMax (if compared with other 10") and I play a 5 strings bass (that can go low to 30 Hz playing the Low B) but simulating the response of the cab (@ 400 Watt) I found some confusing result.
Parameters of the calculated box are (rounded valuse):
Vb=65 liters
Fb=53 Hz
QL=7
F3=54 Hz
FIll=minimal
No. of Vents=2
Dv= 100 mm (calculated pressing the "Suggest minimum vent area for XMax")
Lv= 133 mm
Box measures (external)= W 600, H 400, D 400 mm
Wall Thickness= 18 mm
Maximum Cone displacement 8 mm @ 38 Hz
If I plot the "Normalize Amplitude Response" the F3 is not at 53 Hz as calculated by the program but around at 120 Hz !
And then all frequencies below 232 Hz are below to 0 dB !
So...a cab like this would be unusable for me.
Why this difference between calculated F3 and the "plotted" F3?
I would like to use this cab also as standalone (not coupled with the 1x15") when I have gigs into small pubs so it should have a good response around 30 to 2000 Hz (it will have a tweeter to extend the response up to 18/20 Khz).
Is it something possible with a 2x10" to get close to an "audible" 30 Hz? Or this is just a dream...
Regards,
Roberto
PS: sorry in advance for my english, I'm not english mother tongue.
Last edited:
I've made other tests...I made a simulation with 4 vents (Dv=100 mm, Lv=312) obtaining a F3= 59 Hz with Fb= 63 Hz but still all frequencies between F3 and 200 Hz are below 0 dB.
What can I do to "pull up" those values or, at least, reduce the range of freq. below 0 dB?
Thank you, regards.
Roberto
What can I do to "pull up" those values or, at least, reduce the range of freq. below 0 dB?
Thank you, regards.
Roberto
Maybe you could post a graph of the result. Maybe the problem is not as bad as you feel !
Regards
Charles
Regards
Charles
I've made further simulations increasing the volume Vb (now it's 90 liters) so now Fb=60 Hz and F3=54,81 Hz.
Graphs are the following:
As you can see on the "Normalized Amplitude Response" graph all frequencies between F3 and 226 Hz are below 0 dB.
Is that good? I didn't expect that kind of "saddle" (I hope that is the right term) starting from around 70 Hz to 226 Hz.
How would you judge a box with such graphs?
Graphs are the following:
An externally hosted image should be here but it was not working when we last tested it.
As you can see on the "Normalized Amplitude Response" graph all frequencies between F3 and 226 Hz are below 0 dB.
Is that good? I didn't expect that kind of "saddle" (I hope that is the right term) starting from around 70 Hz to 226 Hz.
How would you judge a box with such graphs?
 .
.
Yes, TS parameters are correct, I copied them directly from the producer web site: B&C SPEAKERS .
Could you explane me the meaning of all those graphs?
Thank you, regards.
Roberto
Could you explane me the meaning of all those graphs?
Thank you, regards.
Roberto
Yes, TS parameters are correct, I copied them directly from the producer web site: B&C SPEAKERS ...
Hi Roberto,
I still cant find published 16 Ohm T/S data at the B&C web site, only for 8-Ohm drivers!
Could you explane me the meaning of all those graphs?
Answer: Hopefully to visualize better ported deigns using the B&C drivers,of course!
You have to put design questions if you want (a) specific answer(s). 😀
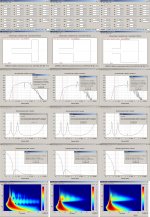
I used the HR= Horn-resp program to simulate ported boxes with 3 different
port diameters/ lengths using a volume of 40 Liters I found to be a Rek. maximum for 2 drivers using your parameters as an input to the HR input screen:
..i.e. the drivers seen Qt in the box is about 0.43 for the drivers(~20L/driver) before completely unloading (and in-band sagging at low frequencies) that also can be calculated if the box have blocked port(s) (i.e. Qtc=0.43).
A driver seen Qt value below ~0.5 (>6.1L/driver) can be considered to extend the lower FR bound at the expense of power handling within the FR extension and the FR will not be flat but sloping if the port length is too long.
The layout screen shows the box system volume = port + the compliance volume(=40L) and that the different port volumes treated separated in the simulations, i.e. the total box internal volume is always the system volume.
The port to nearest driver C-C is chosen to be = 20 cm.
The SPL graphs shows the summed response and the driver contribution separated at an input power level where driver x-mech is not exceeded at 1 Hz.
Both the impedance and excursion plots shows ported boxes tuned below fs.
b 🙂
Are you sure you are actually displaying the amplitude response and not the max SPL ?
Regards
Charles
Regards
Charles
Well...it should be...the title is "Normalized Amplitude Response" (db-SPL/Hz).
Anyway the help of the program reports also "Amplitude response graphs are also referred to as "frequency response" or "magnitude response" graphs".
Anyway the help of the program reports also "Amplitude response graphs are also referred to as "frequency response" or "magnitude response" graphs".
- Status
- Not open for further replies.
- Home
- Loudspeakers
- Multi-Way
- BassBox PRO and F3 calculation on a 2x10" bass cab