Hi all,
I recently revisited my Lambda build. I wanted to try an AMT (ac 2560) tweeter in place of my SB29. So I started by using PCD to completely reevaluate the original design and XO and make changes as necessary. Please keep in mind i am still learning so I am asking for patience for my beginner abilities. I am trying to include the graphs from the tool but I am having difficulty figuring it out. Anyway the response is ragged and I tried lots of ways to try save/upload images of the summed Fr I am having trouble. Help? Thanks 😱
I recently revisited my Lambda build. I wanted to try an AMT (ac 2560) tweeter in place of my SB29. So I started by using PCD to completely reevaluate the original design and XO and make changes as necessary. Please keep in mind i am still learning so I am asking for patience for my beginner abilities. I am trying to include the graphs from the tool but I am having difficulty figuring it out. Anyway the response is ragged and I tried lots of ways to try save/upload images of the summed Fr I am having trouble. Help? Thanks 😱
In PCD, if I understand your question correctly, there is a "Save Summed Response Chart" button just to the right of the graph that shows you graph. Click this button and it will open a window to save the Graph as a .gif format (a picture). You should be able to save the file to your computer and upload on this forum.
If I misunderstood your question, maybe restate and I'll try to assist.
If I misunderstood your question, maybe restate and I'll try to assist.
Another option is "snipping" if you use Windows. Go to "all programs" and look for Windows Accessories and Snipping Tool. This will allow you to basically form a window around what you want to "copy", then you just past in Word, or Paint and save the file in the format you need. Then upload to forum.
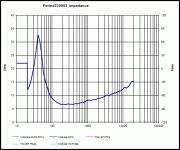
summed resp
Go it. I was looking elsewhere. Ok so this is a 3 way hybrid OB sealed RS270 1.6cu ft, 830883 OB, and recently wanted to try an AST 2560 in place of my SB29. XO points are 300/2500. So I tried to sim the XO using different slopes, frequencies and it looks ragged no matter what I do and doesn't sound so great.
Go it. I was looking elsewhere. Ok so this is a 3 way hybrid OB sealed RS270 1.6cu ft, 830883 OB, and recently wanted to try an AST 2560 in place of my SB29. XO points are 300/2500. So I tried to sim the XO using different slopes, frequencies and it looks ragged no matter what I do and doesn't sound so great.
Attachments

Last edited:
can you show with phase for each speaker in the graph? I would guess either phasing is off or you hearing the back waves of the OB and tweeter cancelling/reinforcing each other.
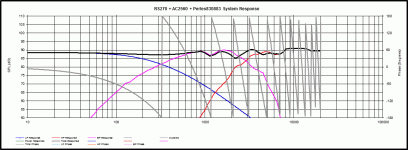
sorry to keep clarifying, but I meant phase "for each" speaker, so the three different phase lines, not "total phase". We need to see exactly where each speaker is phasing with the next.
Also is your woofer real measurement or a trace/estimate? It is way to smooth below 300-Hz
Last question, have you found acoustic centers for all of these and entered the X, Y and Z parameters in PCD? If centered on baffle (give us baffle dimensions), then we just need to know Z for each?
Also is your woofer real measurement or a trace/estimate? It is way to smooth below 300-Hz
Last question, have you found acoustic centers for all of these and entered the X, Y and Z parameters in PCD? If centered on baffle (give us baffle dimensions), then we just need to know Z for each?
see response embedded. thank you so much for taking the time to read my posts and assist.sorry to keep clarifying, but I meant phase "for each" speaker, so the three different phase lines, not "total phase". We need to see exactly where each speaker is phasing with the next.<sure I will post that later today, don't have file accessible to me at this moment>
Also is your woofer real measurement or a trace/estimate? It is way to smooth below 300-Hz<that is a trace from spltrace using manufacturer specs>
Last question, have you found acoustic centers for all of these and entered the X, Y and Z parameters in PCD? <baffle is 11.5 and total speaker width is 13 inch with chamfered ends. I'll post more detailed info later> If centered on baffle <yes> (give us baffle dimensions), then we just need to know Z for each?
OK so the figures from the original design Z offset was -0.06 for the RS270 and -0.025 for the Mid. I assume this will change due to the new reference point? Question: Regarding the phase, do you mean taken form the manufacturers spec sheet?
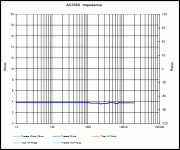
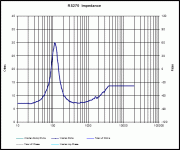
So you haven't taken ZMAs for the new set up or at least tweeter? You just traced it or all speakers?
I'm looking for the graph in PCD that you posted, but instead on total phase, uncheck that and check individual driver phase, so you will have 3 FR lines and 3 phase lines (1 of each for each speaker). Post that graph so we can see the actual FR and phase relationship for all the drivers.
Sent from my iPhone using Tapatalk
So you haven't taken ZMAs for the new set up or at least tweeter? You just traced it or all speakers?
I'm looking for the graph in PCD that you posted, but instead on total phase, uncheck that and check individual driver phase, so you will have 3 FR lines and 3 phase lines (1 of each for each speaker). Post that graph so we can see the actual FR and phase relationship for all the drivers.
Sent from my iPhone using Tapatalk
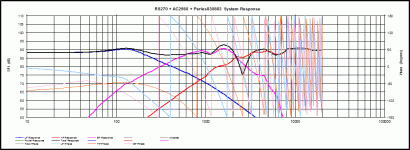
Ive attached the ZMA and individual phase. Looks cluttered.Could/Should I declutter it and do single graphs?
Attachments
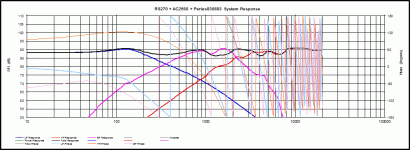
Can you reverse phase of the mid and tweet and post that graph w each individual phase? It doesn't look too bad right now but there may be an off axis problem with the OB.
Also how are you measuring? Distance? And window in ms?
Sent from my iPhone using Tapatalk
Also how are you measuring? Distance? And window in ms?
Sent from my iPhone using Tapatalk
Info
OK, I owe you information from an earlier post/request:
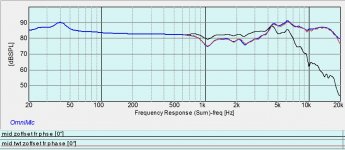
The baffle is 13in W and 41in H. All drivers centered on baffle. The woofer center is 15 from bottom of baffle, Mid is 30 on center, tweeter is 36 on center.
typically I measure about 1 meter away with gating set to 5msec.
BTW, my current crossover with measurements supplied is not the same as the one I modeled in an early post. Once I built and listened to it and tried different slopes and values I decided to stop and go back to PCD and model there.
I will get those measurements done and post. Thanks.
OK, I owe you information from an earlier post/request:
The baffle is 13in W and 41in H. All drivers centered on baffle. The woofer center is 15 from bottom of baffle, Mid is 30 on center, tweeter is 36 on center.
typically I measure about 1 meter away with gating set to 5msec.
BTW, my current crossover with measurements supplied is not the same as the one I modeled in an early post. Once I built and listened to it and tried different slopes and values I decided to stop and go back to PCD and model there.
I will get those measurements done and post. Thanks.
Last edited:
Set your window at 3-3.33 ms which will clean up the graph a little and post the FR graph with phase if you can.
Sent from my iPhone using Tapatalk
Sent from my iPhone using Tapatalk
Without looking at the overall design, it appears your midrange is delayed somewhat compared to the tweeter. I'd expect it is a deeper unit on a flat baffle. To get the phase response closer between them over a wider band, you can increase the order of filter on the tweeter (or reduce on the mid).
Without looking at the overall design, it appears your midrange is delayed somewhat compared to the tweeter. I'd expect it is a deeper unit on a flat baffle. To get the phase response closer between them over a wider band, you can increase the order of filter on the tweeter (or reduce on the mid).
Good point Allen. In the previous version of this speaker I had a SB29 that was set back a little over an inch. I dis not apply any offset to this tweeter. I could however.
I guess I read over that. So you haven't found your "Z" for the new tweeter?
But you do have it for Woofer and Midrange?
I would find the acoustic centers first, which will probably move your phasing some (or a lot) and then go back into PCD and make some adjustments to get your FR and phasing back to a good baseline and re-post. That way we are looking at accurate graphs and can assist with any sound issues you hear with suggestions.
z offset
OK so tonight I worked on the z offset. I do have a problem in that the PCD program wont let me resize the window so I cant convert from meters to inches. (if anyone has a suggestion puhleze! ha ha)
It took me a while to figure out the not-so-straightforward diagram in PCD instructions so I will provide numbers for a sanity check:
In inches
mic to baffle 23in on center (0in)
distance between centers 6in
est depth of voice coil 2in
In mm
584mm/0mm
150mm
0.5mm
After going back into omnimic and summing and overlaying I get a z offset of 1.22inches. Sounds reasonable, no?
Attachments
- Status
- Not open for further replies.
- Home
- Loudspeakers
- Multi-Way
- assistance with 3 way crossover