Of Omholt's pic's:
REW looks like 1/3rd to me, while Arta (excepting the calibration file above 3.5 kHz issue), looks like 1/12.
On the other hand, they both look similar to me overall (with the exception of added smoothing).
Both are useful for different reasons, and while I know the display can be changed on Arta, it just looks a LOT better on REW (irrespective of smoothing differences): just a cleaner look to me.
Best of course to look at multiple (different) smoothing graphs (..and I generally like to use 1/48th for driver problems, along with a close-up of impedance and even a CSD plot).
Last edited:
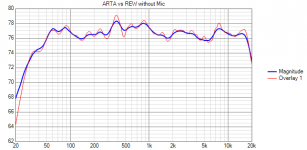
The ARTA measurement is shown on a 45 dB whereas the REW is 70 dB scale.
For comparison both should be the same scale.
For comparison both should be the same scale.
REW vs ARTA without mic compensation:
https://www.diyaudio.com/forums/attachment.php?attachmentid=790366&stc=1&d=1572041878
https://www.diyaudio.com/forums/attachment.php?attachmentid=790366&stc=1&d=1572041878
Attachments
REW looks like 1/3rd to me, while Arta (excepting the calibration file above 3.5 kHz issue), looks like 1/12.
REW is radically too smooth if we specify that 1/3 oct. smoothing equals average pressure from -1/6 to +1/6 octs. Smoothing of pressure values with linear average leaves quite much small curves - even more than ARTA shows. REW probably uses some other algorithm than linear average. Maybe some curve fitting where octave band is just given name which has nothing in common with linear average within selected band. Smoothing with features of graphics libraries are able to produce same kind of "oversmoothed" curve than REW shows.
But this topic is just subjective without specifying what e.g. 1/3 oct. smoothing really means mathematically; linear average, median filter, curve fitting or whatever.
Last edited:
Thanks mbrennwa! ARTA saves impulse responses as .pir, which seems to be some kind of binary format.
Thanks tmuikku for providing the file examples (via PM). I found the documentation of the PIR format (ARTA manual, page 72) and started working on an import tool for MATAA. However, I got stuck because I don't know the byte lengths of the data fields. In particular, how many bytes are "int" and "float"? Also, what is the byte order (LSB or MSB first)? Ivo?
Could export to ASCII text file or CSV.
The ASCII files are ***almost*** good for use with the mataa_import_TMD tool for use with *.TMD files. However, the header lines for TMD files are assumed to start with a "*" character to tell them apart from the numeric data. The ASCII files exported from ARTA don't follow this convention.
However, it should be relatively painless to write a simple Octave/Matlab script that loads the ARTA ASCII files by skipping the header lines before reading the numeric data. Then subtract the mean of the signal, and you're done.
Hi mbrennwa, others. Spent a better half of a day doing measurements with ARTA and noticed too late there was arbitrary DC offset / low frequency noise ruining most of the measurements... Being novice, didn't notice it before trying to simulate crossover. Live and learn. I found some of you were discussing about the same issue back in January 2019.
I don't know when I have another day off to take new set of measurements so it would be worth trying to salvage some of these.
Any tips if there was a way to clean some of the low frequency anomalies out? Checked out MATAA but it pretty much requires some custom code bulk process files from ARTA? I would be pleased if there was a tool to batch process these since full 360 hor + ver measurement sets for a huge three way speaker was commenced 😎
I tried to find out what was causing the problem afterwards, but didn't find it out yet. Might be bad connector in my old sound card. It didn't occur on single channel measurements, only on two channel. Tried swapping between left and right, same problemo.
Thanks!
Thanks tmuikku for providing the file examples (via PM). I found the documentation of the PIR format (ARTA manual, page 72) and started working on an import tool for MATAA. However, I got stuck because I don't know the byte lengths of the data fields. In particular, how many bytes are "int" and "float"? Also, what is the byte order (LSB or MSB first)? Ivo?
Ok, got it working. Import for binary ARTA / PIR data files to MATAA is now possible (see latest code on github). The example files I got from tmikku show some non-zero values for the (repeated!) reserved1 and reserved2 fields, which should be zero according to the documentation. I don't know if this is specific to tmikkus files, or if this is a general thing with ARTA. Another (and possible more concerning issue) I see with the ARTA PIR files is that the data seems to be uncalibrated, and the frequency response data of the microphone frequency response is missing in the data files. There is no way to "fix" the uncalibrated data for the non-linearity of the microphone (or whatever sensor was used for the measurement).
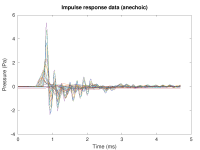
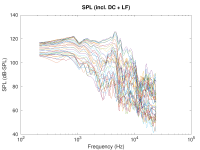
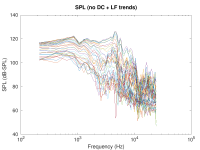
I attached an Octave m-file and three plots that shows how to use the ARTA import for MATAA, and how to remove the DC (and low-frequency trends/noise) from the gated impulse response data. With tmikkus data, the removal of the DC (and low frequency trends) does not make a difference, because the low-frequency cut off is at about 220 Hz after gating, and the DC / LF-noise is not relevant > 220 Hz.
Attachments
Your were right about the mic calibration file effects the result. But why isn't that case with REW, which also uses the same mic cal file?That crap EMM-6 calibration file makes most of the curves. And there is no such thing as "correct smoothing". Just several different mathematical methods. Author or user chooses which one looks subjectively the best or is easiest to implement.
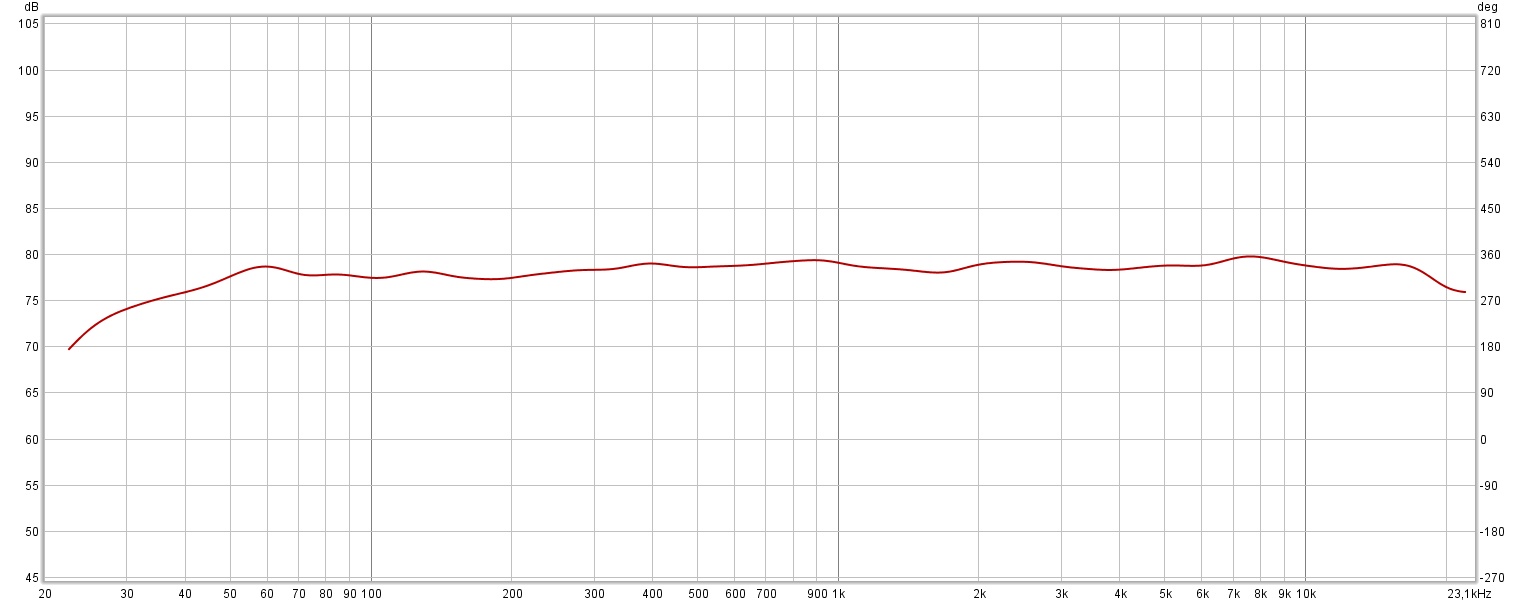
Here's the result with the mic freq. compensation file and 1/3 oct. smoothing:
Without the calibration file. It's now much smoother in the highs but with a different low frequency response and which seems inaccurate.
REW with 1/3 oct. smoothing with calibration file:
Attachments
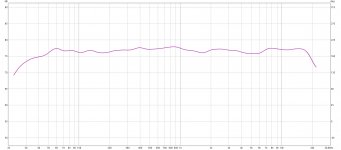
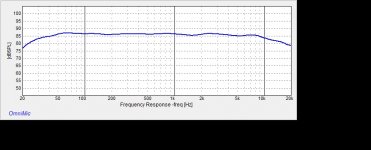
A new measurement with Omnimic and REW. Omnimic uses a different mic, which has a smaller diameter and which should give a more accurate result in the very highs.
Omnimic with 1/3 oct. smoothing:
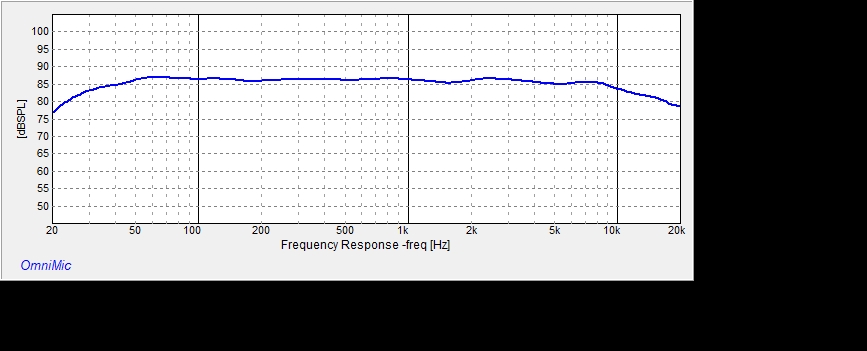
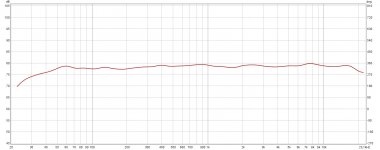
REW with 1/3 oct. smoothing:
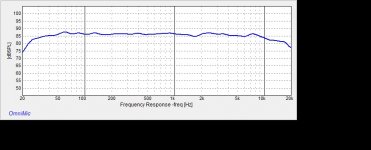
Omnimic smooths more than REW. Here's one with 1/6 oct.
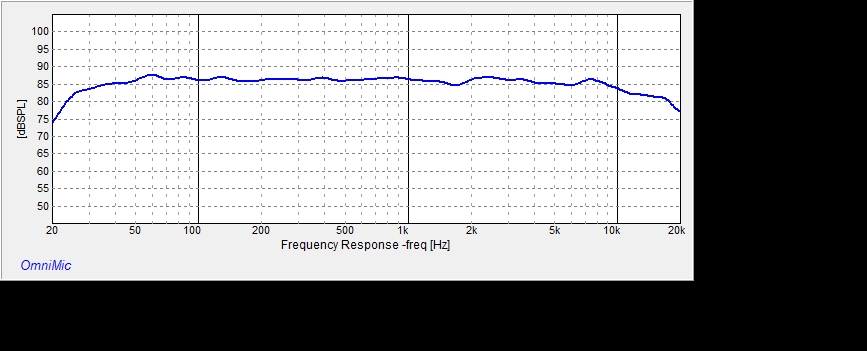
Omnimic with 1/3 oct. smoothing:
REW with 1/3 oct. smoothing:
Omnimic smooths more than REW. Here's one with 1/6 oct.
Attachments
But why isn't that case with REW, which also uses the same mic cal file?
You should ask this from JohnPM in some REW thread. Looks that products such as CLIO and ARTA calculate average pressure within given smoothing band. VituixCAD also for sure, but scaling to sparse f-axis causes more curves and level variation (at the moment).
REW calculates something else or graphics curve function causes much more smoothed result compared to previous.
Measurement program is free to assume that calibration file is fact and valid without smoothing separately or with measured raw response. Dayton should provide decent files which could be applied after smoothing of measured raw response.
It does look though like the response with ARTA is being screwed above a certain frequency with the mic cal for some reason. Something that doesn't happen with REW.
ARTA does not screw anything. What ARTA does with the mic file you can read in the Manual.
Otherwise, please follow the advice of Kimmo.
Regards
Heinrich
Otherwise, please follow the advice of Kimmo.
Regards
Heinrich
Fractional octave smoothing defines a bandwidth but not a smoothing kernel. An average is one choice, though averaging is a pretty poor attempt at a filter and produces artefacts that are not what one would arguably expect to see from a filter of the specified bandwidth. Looking more broadly at smoothing functions across domains Gaussian responses are often chosen. Multiple passes of a simple running average filter provide a response that comes ever closer to a Gaussian with each pass, multiple forward and backward passes of a running average filter are one option for fractional octave smoothing.REW is radically too smooth if we specify that 1/3 oct. smoothing equals average pressure from -1/6 to +1/6 octs. Smoothing of pressure values with linear average leaves quite much small curves - even more than ARTA shows. REW probably uses some other algorithm than linear average. Maybe some curve fitting where octave band is just given name which has nothing in common with linear average within selected band. Smoothing with features of graphics libraries are able to produce same kind of "oversmoothed" curve than REW shows.
But this topic is just subjective without specifying what e.g. 1/3 oct. smoothing really means mathematically; linear average, median filter, curve fitting or whatever.
By default ARTA uses brickwall cutoffs at the specified fractional octave bandwidth, though the manual doesn't specify the smoothing function used over that bandwidth. There is, however, a "Filtered smoothing" option which uses a 6th order Butterworth bandpass filter shape. HolmImpulse applies its smoothing using a window function in the frequency domain, Blackman I believe. REW targets a Gaussian kernel of the specified bandwidth, though the implementation uses a very efficient method to closely approximate a true Gaussian filtered response.
Ok, got it working. Import for binary ARTA / PIR data files to MATAA is now possible (see latest code on github). The example files I got from tmikku show some non-zero values for the (repeated!) reserved1 and reserved2 fields, which should be zero according to the documentation. I don't know if this is specific to tmikkus files, or if this is a general thing with ARTA. Another (and possible more concerning issue) I see with the ARTA PIR files is that the data seems to be uncalibrated, and the frequency response data of the microphone frequency response is missing in the data files. There is no way to "fix" the uncalibrated data for the non-linearity of the microphone (or whatever sensor was used for the measurement).
I attached an Octave m-file and three plots that shows how to use the ARTA import for MATAA, and how to remove the DC (and low-frequency trends/noise) from the gated impulse response data. With tmikkus data, the removal of the DC (and low frequency trends) does not make a difference, because the low-frequency cut off is at about 220 Hz after gating, and the DC / LF-noise is not relevant > 220 Hz.
Thanks for the example octave .m file mbrennwa!
I'm interested how did you figure out if the data is uncalibrated? Was there a record to note this in PIR file or did you see that from the data itself? Just checked the mic calibration should have been on, and I have done the audio device calibration. Don't know what else should I calibrate? My rotating measurement jig was not millimeter precise and SPL levels are off so they are some red flags. SPL is affected by so many things I didn't bother setting it up, plan is to offset SPL levels later in VituixCAD. Surely if there is some errors in the data, it must be because of my inexperience 🙂
Since you thought DC/low frequency noise error didn't matter in the measurement set let me explain where I noticed it:
There is a difference with DC correction or not (in VituixCAD) since it interpolates the missing low frequency response from the short FFT window (measuring at home). In VituixCAD merge tool, the low end is corrected by merging near field measurement and baffle diffraction data to the far field measurement allowing a DIY person to have acceptable data set to do proper crossover simulation. Not sure what is the math in the merge, but the result seem to have the trend from the far field measurement (low end shooting up randomly depending on the measured error!) and detail from the near field measurement. Long story short without DC correction some far field measurements were like 30db up on the bottom octave relative to others (say the next measurement, 10degree difference) so few measurements with most error dominated the low end, in VituixCAD.
So, whos fault is it? ARTA recorded error in my livingroom setup, and that error was pronounced in VituixCAD, so I think it is an operator error 🙂 asked for help and got some, so thanks! Surely, it is hell of a task to measure and process data for a crossover simulation, many stage process prone to human mistakes.
Anyway, thanks mbrennwa again for the PIR file import. MATAA seems to be powerful tool for DIY folk.
Last edited:
..."Filtered smoothing" option which uses a 6th order Butterworth bandpass filter shape. HolmImpulse applies its smoothing using a window function in the frequency domain, Blackman I believe. REW targets a Gaussian kernel of the specified bandwidth...
Longish kernels such as Gaussian seem to have higher risk of phase response artefacts for example if frequency response has combination of excess delay and sparse frequency axis, or some error due to crash with Nyquist/2 etc.
The latest build of VituixCAD has Tukey 0.50 implemented so that selected smoothing band is within -3dB points of Tukey function. That kernel is "just" 2x smoothing width which is also convenient to calculate. It's not as smooth as Gaussian or Blackman but looks okay at least imo.
So VCAD can be used to smooth ARTA pir files in frequency domain if some other filter function is preferred.
I'm interested how did you figure out if the data is uncalibrated?
The data file has a field that contains the sensitivity of the microphone. The impulse response data needs to be divided by this value to get sensible numbers. This tells me that the impulse response data is simple the voltage coming from the ADC (soundcard), not the pressure data that has been deconvolved with the microphone frequency response to compensate for the non-flat frequency response of the microphone.
There is a difference with DC correction or not (in VituixCAD) since it interpolates the missing low frequency response from the short FFT window (measuring at home). In VituixCAD merge tool, the low end is corrected by merging near field measurement and baffle diffraction data to the far field measurement allowing a DIY person to have acceptable data set to do proper crossover simulation. Not sure what is the math in the merge, but the result seem to have the trend from the far field measurement (low end shooting up randomly depending on the measured error!) and detail from the near field measurement. Long story short without DC correction some far field measurements were like 30db up on the bottom octave relative to others (say the next measurement, 10degree difference) so few measurements with most error dominated the low end, in VituixCAD.
So, whos fault is it? ARTA recorded error in my livingroom setup, and that error was pronounced in VituixCAD, so I think it is an operator error 🙂 asked for help and got some, so thanks! Surely, it is hell of a task to measure and process data for a crossover simulation, many stage process prone to human mistakes.
Merging far-field SPL curves with near-field curves can be tricky, and there are different ways to do it. Your SPL curves in post 832 show a steep fall-off below 150 Hz or so. I guess the test signal captured by the microphone did not have a lot of energy below this frequency (either because the original test signal did not contain it, or because your speaker falls off below 150 Hz). Some curves also show quite a bit of SPL below 80 Hz or so. I guess this is just noise. However, All this data seems to be bogus anyway, because the gated impulse response does not allow calculating anything below 200 Hz or so. I guess it would be best to reconsider the gating of your far-field data, and not use any SPL data below the corresponding cut-off frequency.
..Tukey 0.50..
oops typo, it's Tukey 0.75
compared to some others
An externally hosted image should be here but it was not working when we last tested it.
Thanks for useful tips mbrennwa! Gating and merging could be done outside VituixCAD, but I'm not yet comfortable trying it since all this is new and not really knowing when the result is what it should be 😀
The measurements I sent are from 3 way speaker mid driver and should roll off around 200Hz or so. Also the woofer and tweeter measurements I did the same day are affected by this low frequency error. Gotta make next measurement day faster with better rotating jig and check results frequently for errors.
The measurements I sent are from 3 way speaker mid driver and should roll off around 200Hz or so. Also the woofer and tweeter measurements I did the same day are affected by this low frequency error. Gotta make next measurement day faster with better rotating jig and check results frequently for errors.
The measurements I sent are from 3 way speaker mid driver and should roll off around 200Hz or so. Also the woofer and tweeter measurements I did the same day are affected by this low frequency error.
I am not convinced that there is an "error" with your measurements. I guess it's just that you're using ungated impulse responses that will show a lot of stuff going on below the anechoic cut off. This is likely just noise.
What was the geometry of your setup? Distance between speaker and microphone? Distances to the nearest wall / floor / ceiling? A drawing might help.
All this data seems to be bogus anyway, because the gated impulse response does not allow calculating anything below 200 Hz or so. I guess it would be best to reconsider the gating of your far-field data, and not use any SPL data below the corresponding cut-off frequency.
Your message is bogus. Ideal flat frequency response is single IR pulse so gating does not prevent at least everything. Some limits exist and requirements to measurement gear and environment are higher, but rough directivity estimation of LF is possible also with gated measurements. If requirements are not full-filled, choices are larger measurement space with longer time window, anechoic or simulation of directivity. I use the last option in case LF measurements were not succesful enough for LF directivity estimation. VCAD Merger supports both methods.
Try to focus topic which is ARTA.
Your message is bogus.
Aha.
Ideal flat frequency response is single IR pulse so gating does not prevent at least everything.
Sure, but we're looking at non-idealised reality here. The length (duration) of the anechoic data of an impulse response is limited by the reflective objects around the speaker and the microphone (walls, furniture, etc.). This is why the raw impulse response data is gated to cut off the echoic part. The lowest frequency component that can be determined from the anechoic (gated) part is the inverse of the length of the gate time. It is not possible to determine anything about frequencies lower than this limit from the anechoic impulse response (except DC, but that's not the point here).
Kimmo, I'll stop here. We had our arguments about something else before. I guess it's best we don't get started again.