But note that the half-octave cutoff shifting in such circumstances will appear just as a theoretical 3dB boost below a certain frequency superimposed over the 6dB theoretical boost due to the two drivers playing together.
This makes quite sense when you are measuring more than 6dB boost at very low frequencies, while the expected result would be to measure slightly less than 6dB (and never more than the theoretical absolute maximum!!).
This makes quite sense when you are measuring more than 6dB boost at very low frequencies, while the expected result would be to measure slightly less than 6dB (and never more than the theoretical absolute maximum!!).
The top plot has the 6dB boost over it's whole range, so we can ignore it for the now. There is no boost at all at the 25 - 30Hz range, where there should be if there was a lowering of cutoff.
The curves are exactly the same, just 6dB different.
Rob.
The curves are exactly the same, just 6dB different.
Rob.
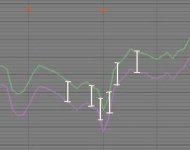
9dB is the sum of theoretical maximum gains, while your plot shows 7dB in the lowest region, that tend to drop to 5dB for higher frequencies.
Note that placing two drivers together *can't* produce more than the 6dB absolute maximum theoretical gain. Furthermore, practical real-world gains for two drivers are more like 5dB only, and your plot shows an otherwise unexplainably higher gain of 7dB.
Also, my 3dB figure for additional gain is theoretical only, you can't expect to get 3dB in real world, but 1dB or 2dB seem more reasonable.
- Status
- Not open for further replies.