This tells me that you aren't getting the window around the impulse properly. For now, or any time you just need a response plot you can use the function shown in the attached image. This removes all normal delay from the impulse which lines it up with the left edge of the window but also includes some time before it. You then only need to ensure there is enough right window.I am still getting unexpected and inconsistent results. I started using the built in acoustic timing with REW that led to more uniform results.
It does, but pink noise has some disadvantages. Signal to noise ratio is one. Pink noise is sometimes used to position subs.pink noise
Attachments

Interesting that REW doesn't seem to have a function to use pink noise for measurement but relies on a frequency sweep.
One of the strengths of REW is its help system. For example, in the opening "Welcome to REW" section:
"REW uses a logarithmically swept sine signal for its measurements. This is much faster than manual measurements, more accurate, less likely to suffer from clipping at resonances, less sensitive to system non-linearity than MLS and allows the impulse response of the room to be determined, which in turn is the basis for many additional features. When using the Real Time Analyser displays REW can generate Pink Periodic Noise sequences for much better visibility of low frequency behaviour than obtained using random Pink Noise without the need for lengthy averaging."
Using a USB mic also can cause problems. Another excerpt from the help system (my underlining):
"If the input and output are on the same device and so share a common clock longer sweeps will provide higher signal-to-noise ratio (S/N) in the measurements. Long sweeps may be problematic when the input and output are on different devices, such as when using a USB mic, as their sample clock rates will differ. Over a long sweep a significant difference in clock rates could cause severe distortions in the shape of the impulse response and affect the phase response. This can be corrected by using the acoustic timing reference and the Analysis option to Adjust clock with acoustic ref .
So I think your move to the Scarlet and Dayton mic is one you won't regret.
^ good point Sangram! need to make sure the underlying sound hardware is producing flat results.
Additionally have you loaded the cal file for the mic. the EMM6 should come with a cal file specific to it's serial number which you can download from dayton. edit: sorry see you are going to purchase an emm6. you could do that first before getting the scarlett (I have a gen1 and it has been great). You need to make an adapter for the emm6 before you can use it with something that uses a two pole or 3 pole input.
Tony.
Last edited:
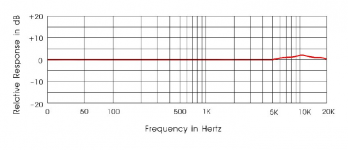
Looking at your DBX microphone, if the frequency response chart it shows is accurate then things are even more odd. It actually shows rising response from 5K looking like about +4db at 10Khz...
Is it possible the tweeters are faulty? Do you have any other speakers with extended high frequency response that you could measure as a comparison?
edit: also perhaps you could upload your rew mdat file so we can have a look at the actual measurement.
Tony.
Is it possible the tweeters are faulty? Do you have any other speakers with extended high frequency response that you could measure as a comparison?
edit: also perhaps you could upload your rew mdat file so we can have a look at the actual measurement.
Tony.
Attachments
Last edited:
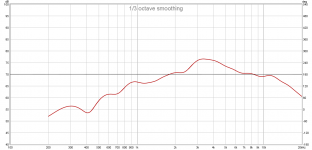
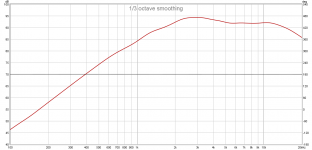
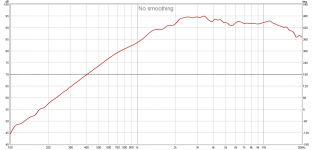
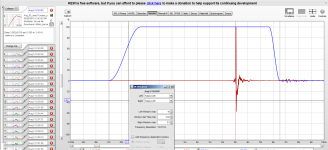
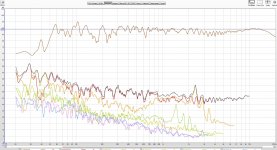
Just on what Allen said about the windows. Below are images of firstly incorrect and then correct windowing for my DMS37 tweeter. Note this is semi horn loaded so the increase at lower frequencies is normal. I had to use 1/3 octave smoothing to get something even close to the smoothness of your measurement, but the third one is with correct window and no smoothing..
Fourth image shows how I have the window set. Note that these measurements were done with a reference channel and the 3.04 ms was the baseline for all of the off axis measurements.
Tony.
Fourth image shows how I have the window set. Note that these measurements were done with a reference channel and the 3.04 ms was the baseline for all of the off axis measurements.
Tony.
Attachments
When I was new to REW I never gated or smoothed my measurements. I didn't know better.
This is an example of such a measurement with a correct calibration file and a decent input system. I was using a Dayton EMM-86 with a Behringer mixer and a e-Mu 1212m PCI.
The speaker in the measurement is this one: Zaph|Audio
The image is unsmoothed, ungated response which is why you see so much ripple. The average FR though is reasonably flat with a slight dip in the mid-treble region, which is in the middle of the tweeter's passband. You should have had something similar, but uncalibrated microphones and poor converters can get you some strange looking results. You should first do a loopback to establish baseline converter performance, and then a known speaker to establish microphone performance. REW can add or subtract results and arrive at actual performance of your design once these baselines are established.
I know I strike a discordant note in this, but since my measurement system collapsed I have not replaced it and now use manufacturer data for design. I check the results later with slow sweeps and measure it using my phone's SPL meter. It's ghetto, but it works and I haven't really had to mess with anything other than incorrectly set levels, or reversed drivers.
The design process becomes a lot more complicated though because you spend hours on the sims trying to balance and even things out, estimate the effects of box and baffle and one mistake can ruin a project. Measurements take a lot of the guesswork out of the design but they're not a fix-all. Fundamental problems in the design will still give you issues. Insufficient roundovers, missed cutout chamfersand air leaks will still give you headaches.
Attachments
I took some new measurements this morning but got called into work... ugh! The measurements are still showing anomalies with a few set up and windowing tweaks. I think I will wait a few days for the mic and new audio interface to come in. Thanks again for everyone’s help thus far.
Good idea (save them and post the save file).perhaps you could upload your rew mdat file so we can have a look at the actual measurement.
I had tried posting those this morning but the files were not to the forum. I thought it might be due to the .mdat formatting? Is there another file format this site will accept from REW?
zip the file first, if you don't have a zip program, 7zip is a free one just choose the format as zip when compressing.
Tony.
Tony.
Will do. Right now I’m gonna have a pint or three and get these thoughts of resonance dissipation in my notebook. Do you have any cabinet construction pet projects you’ve wanted to try? Mine involves coupling the driver to a bracing structure that uses some sort of sand or non-Newtonian fluid to absorb the resonance...
This is why I need to get the measurements working well. I’m here for the science as well as the quality of sound. I need to be able to build, test, repeat. Without confidence in my measurements I cannot move forward.
Here are some of my measurements from REW. These were taken outdoors on a 7ft ladder. I included a measurement of my Polk LSi9 using the same setup but taken on a different day for reference.
The new audio interface and microphone should be in around the 11th.
The new audio interface and microphone should be in around the 11th.
Attachments
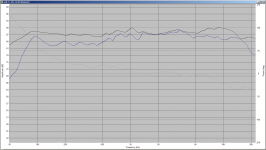
I only see the measurement of the polk in the file. It doesn't seem to have as much of a rollof in the high frequencies, but comparing it to measurements I found online Polk LSi9 surround speaker system Measurements | Sound & Vision
It definitely is showing the same trend as your other measurements when compared, in that the measurement above is tapering up in the higher frequencies and yours is tapering down.
I spl traced both and superimposed them in speaker workshop and you can see there is quite a difference.
Blue is your measurement and black is the sound and vision one.
Your measurement was very clean, no sign of major reflections at all, but I suspect that you are getting some interference from the ladder itself as it was hard to get gating that gave a smooth response. what I used for the comparison was actually 1/12 octave smoothed rather than gated.
Tony.
Attachments
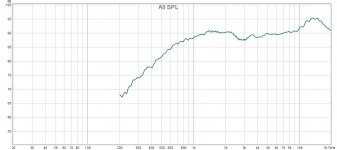
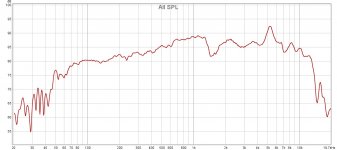
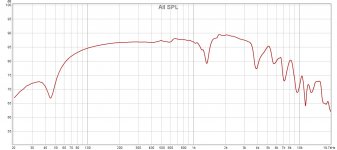
Here are the measurements with the new Focusrite Scarlet 2i2. I am still waiting on the new microphone and calibration file. It looks like I am getting decent results now. Thank you for the help!
Now I am turning my attention to crossover design and how to address some issues I find in these measurements.
I plugged these measurements into VituixCAD and I am concerned with the big dip in the woofer around 1.5K! It looks like I would have to take the tweeter very low to help fill in that hole. This hole doesn't seem to be there in the manufacturer's specs.
Do I need to break these in before measuring again?
How low would you take this tweeter? It's resonance frequency is about 500Hz so I should be able to push it down to 1.5K without a lot of issues... right?
Would I solve some of these issues by redesigning the baffle and centering the tweeter? I'm already considering a new design based on flattest base response. Volume around 9.5 L and Tuned to 59.4 Hz
Attachments
How low would you take this tweeter? It's resonance frequency is about 500Hz so I should be able to push it down to 1.5K without a lot of issues... right?
This is what John Krutke said about the XT25 tweeter:
Smoothest and most extended response curve in the group, and resulting CSD is excellent. Good tall order HD above 2kHx, but average 2nd order HD. Poor HD levels of all types below 2kHz, even considering the extended low end. It may have a 500 Hz Fs, but don't think about crossing it below 2kHz LR4 or 2.5kHz LR2.
Ralf
And please post an image of the woofer FR, the content of the zip files does nothing for me.
Ralf
Ralf
Here are the jpegs of the measurements the previous files are from REW if that helps. Thanks for having a look.
It would also help if you had some rough values of components I could start with...
It would also help if you had some rough values of components I could start with...
Attachments
- Home
- Loudspeakers
- Multi-Way
- Anomalous REW driver readings? 2-way design help!