Underneath the plot window you can select traces - turn off 'Peak', and change the 'graph axis limits' (top right symbol) to show the noise floor as well as the peaks. You can take a snapshot (camera icon top left) of what you are seeing.
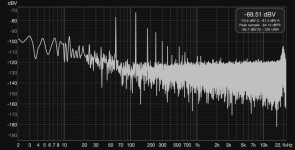
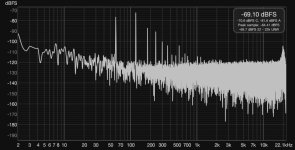
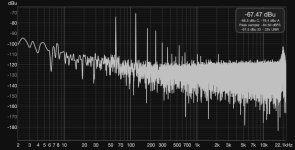
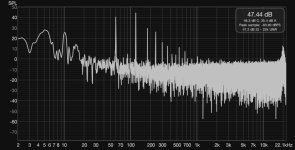
I took a few different measurements, and one with the amp off.
I guess that these are measurements relative to the noise floor, & that is what is important?
I guess that these are measurements relative to the noise floor, & that is what is important?
Attachments


Look up help/threads for 'averaging' options and play around. Use your meter to measure a sinewave generated by your interface, and confirm you can vary that level, and confirm it varies in RTA spectrum. Use say a 1kHz sine. See if you can notice harmonics change as signal level is increased up to max. Check your interface specs for signal level capability.