Thanks a lot @fluid. That is a big list of tracks.. 🙂 I am making Tidal playlists of all suggested tracks.. 🙂
I started with few of the songs and I like them already.. 🙂
I like Fleetwood Mac's 'the chain' a lot too. I think I first heard about that song in one of your posts somewhere in this forum or another.. My only complaint with that song is the vocals in it seem to be very feeble and strained compared to everything else going on in it.. Still I like it.. 🙂
That was the very short version 🙂Thanks a lot @fluid. That is a big list of tracks.. 🙂
I forgot one that I always use which is Moby Dick by Led Zeppelin, almost entirely a John Bonham solo, I think the VU meters took a pounding when they recorded that one. The 24 bit 96K remasters really are the best versions of all the Led Zep tracks.
Luckily it's not the vocals I'm interested in for the chain because you are right.
For a female vocal track I like Snarky Puppy - Too hot to last - (Lucy Woodward)
I also look for Japanese CD versions if they are available, the mastering for Japan always seems better. The difference on some tracks and albums is huge.

I worked at a record store during the second half of the noughties. We catered to a group of customers who exclusively ordered Japanese CDs and SuperCD releases, often expressing disappointment if certain items were unavailable. At the time, I thought it was just hi-fi snobbery, especially since we couldn't hear the difference on our basic hi-fi system at the store. Now, though, I'm less certain. Conducting a comparison would be intriguing.
I'd agree with @fluid that more often than not, the Japan releases seem to have a good, well balanced sound. Quite often there are large variations between the releases for different continents. Most of the time it is the mastering that is different while they used the same base material.
Even high res material often has a differing tonal balance, making it harder to guess what is making it sound better 😉.
Even high res material often has a differing tonal balance, making it harder to guess what is making it sound better 😉.
For great kick drum I like the opening bars of "Dani California" by Red Hot Chili Peppers. "World Turning" by Fleetwod Mac has great drum and bass lines that reveals low frequency performance.
Rachmaninov Piano Concerto is very dense, and difficult to get realistically reproduced. A good recording is Alexander Korsantia with the Stuttgarter PhiliharmonikerFor me the biggest separator of speakers from good to bad comes when the tracks become dissonant, dense and difficult.
I much prefer the production value on Blood Sugar Sex Magik, the whole album is great. I rewound that cassette a lot when I was young 🙂For great kick drum I like the opening bars of "Dani California" by Red Hot Chili Peppers.
For some virtuoso Jazz noodling Dennis Chambers is always good
I have been following a discussion on the JMLC/Yuichi thread about horns and minimum phase response etc. I was curious about what more (if any) can be learnt from the frequency response magnitude and phase plots together (didn't want to pollute that thread so asking the question here). 🙂
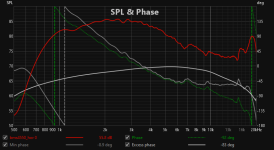
Here is the on-axis response (frequency response magnitude, measured phase after removing delay and minimum phase generate by REW) of my BMS 4550 driver on ST260KVAR:

Here is the same data after equalizing the driver response to 'flat'ish using REW AutoEQ:

What all can we learn from these plots..?
Here is the on-axis response (frequency response magnitude, measured phase after removing delay and minimum phase generate by REW) of my BMS 4550 driver on ST260KVAR:
Here is the same data after equalizing the driver response to 'flat'ish using REW AutoEQ:
What all can we learn from these plots..?
Hi,
looks to be about minimum phase. If there was some blip on the measured phase it would be some resonance I guess, or something. I really haven't bothered with the phase too much, mainly because it seems to be about minimumphase and haven't had problems that would have required to inspect the phase.
Here is some old measurement of mine, hf10ak in the sth100 waveguide on some baffle I think. VituixCAD shows measured phase as normal phase, then it automatically shows minimum phase and also excess phase which shows difference between the two I think.
Quite min phase as well

They deviate below pass band band, not sure why, perhaps due to windowing and some DC error or something in the measurements. This is from 4 years ago, about my first measurements ever.

To get these normal and minimum phase draw closer on the top octave than yours I had to adjust the propagation delay with microsecond precision, millimeters. I get -180deg excess phase at 20kHz like you have if I tune the delay about 23us. 25us would be half wavelength of 20kHz, as time of course 🙂

So, the excess phase when roughly flat means all propagation delay is tuned out and now it shows how much measured phase deviates from minimum phase. My device has some resonance on the top, phase plug delays and dome breakup and stuff like that I assume.
We should follow the thread, there is information coming up 🙂
edit. out of interest, hf10ak in RCF h100 and in ST260. The ST260 measurement has capacitor in series. Top looks about the same, some roughness. Not sure if this is the same hf10ak on each, or the other one I have.


edit2. this is 8pr155 8" midrange driver in passive cardioid box, pretty much min phase as well for the usable bandwidth. Some wiggle at cone breakup.

Both the compression driver and the woofer show the breakup in frequency response and with some basic knowledge on loudspeakers we know what they are and no need to stress about the phase, the breakup should be avoided if possible. They look bad on any graph, on the group delay and magnitude graphs including polar graph.
looks to be about minimum phase. If there was some blip on the measured phase it would be some resonance I guess, or something. I really haven't bothered with the phase too much, mainly because it seems to be about minimumphase and haven't had problems that would have required to inspect the phase.
Here is some old measurement of mine, hf10ak in the sth100 waveguide on some baffle I think. VituixCAD shows measured phase as normal phase, then it automatically shows minimum phase and also excess phase which shows difference between the two I think.
Quite min phase as well
They deviate below pass band band, not sure why, perhaps due to windowing and some DC error or something in the measurements. This is from 4 years ago, about my first measurements ever.
To get these normal and minimum phase draw closer on the top octave than yours I had to adjust the propagation delay with microsecond precision, millimeters. I get -180deg excess phase at 20kHz like you have if I tune the delay about 23us. 25us would be half wavelength of 20kHz, as time of course 🙂
So, the excess phase when roughly flat means all propagation delay is tuned out and now it shows how much measured phase deviates from minimum phase. My device has some resonance on the top, phase plug delays and dome breakup and stuff like that I assume.
We should follow the thread, there is information coming up 🙂
edit. out of interest, hf10ak in RCF h100 and in ST260. The ST260 measurement has capacitor in series. Top looks about the same, some roughness. Not sure if this is the same hf10ak on each, or the other one I have.
edit2. this is 8pr155 8" midrange driver in passive cardioid box, pretty much min phase as well for the usable bandwidth. Some wiggle at cone breakup.
Both the compression driver and the woofer show the breakup in frequency response and with some basic knowledge on loudspeakers we know what they are and no need to stress about the phase, the breakup should be avoided if possible. They look bad on any graph, on the group delay and magnitude graphs including polar graph.
Last edited:
Thanks @tmuikku 🙂
I am following that thread with a lot of interest.. 😀
Just for reference, here is my VituixCAD plots for frequency magnitude and phase responses, along with minimum phase and excess phase.
I just exported the REW measurement as a text file and saw some changes in the phase responses between REW and VituixCAD.
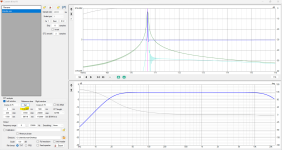
Here is the VituixCAD plot.

Here is the default plot in REW (without adding the LF and HF tails)

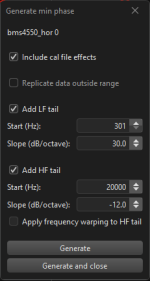
In the above, the REW excess phase looked different from VituixCAD excess phase. So did the phase responses near the extremes (close to 500Hz and close to 20kHz). So I tried with adding LF and HF tails to the minimum phase response construction with the following settings:

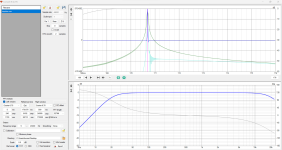
Now the responses looked like below in REW:

Now the excess phase response & minimum phase response look more similar between REW and VituixCAD. 😀
Unfortunately, I measured the CD+horn only from 300Hz to 22kHz or so (I was scared of damaging the compression driver trying to reproduce 20Hz kind of frequencies). So the real LF data is missing and probably VituixCAD will fill the unavailable data from 20Hz to 300Hz using some method and that causes the changes in phase response I think... 🙂
So can't trust the minimum phase version much I guess, especially at the extremes of the measurement range as it is program dependent about how it interpolates the missing data.
Maybe something along these lines is what Kimmosto has been saying for ages (He also advises to take measurements starting from 5Hz or so for all drivers I think).
I am following that thread with a lot of interest.. 😀
Just for reference, here is my VituixCAD plots for frequency magnitude and phase responses, along with minimum phase and excess phase.
I just exported the REW measurement as a text file and saw some changes in the phase responses between REW and VituixCAD.
Here is the VituixCAD plot.
Here is the default plot in REW (without adding the LF and HF tails)
In the above, the REW excess phase looked different from VituixCAD excess phase. So did the phase responses near the extremes (close to 500Hz and close to 20kHz). So I tried with adding LF and HF tails to the minimum phase response construction with the following settings:
Now the responses looked like below in REW:
Now the excess phase response & minimum phase response look more similar between REW and VituixCAD. 😀
Unfortunately, I measured the CD+horn only from 300Hz to 22kHz or so (I was scared of damaging the compression driver trying to reproduce 20Hz kind of frequencies). So the real LF data is missing and probably VituixCAD will fill the unavailable data from 20Hz to 300Hz using some method and that causes the changes in phase response I think... 🙂
So can't trust the minimum phase version much I guess, especially at the extremes of the measurement range as it is program dependent about how it interpolates the missing data.
Maybe something along these lines is what Kimmosto has been saying for ages (He also advises to take measurements starting from 5Hz or so for all drivers I think).
Attachments
Last edited:
Yeah this is sort of a gray area for me as well, haven't dug too deep into it mainly because I'm stuck with home measurements. I've always known the phase / windowing / measurement stuff, splicing in the nearfield measurements and all that is where the error is in home measurements. Perhaps studying the subject a bit more could help evaluate error better and get to final xo:s sooner, if they happen to be around the grey area (<<1kHz) like with some 3-way systems. On the other hand, there is quite long passage scrolling DSP delay knob on the low xo where there doesn't seem to be any change in the sound so as big margin of error to ear as there is with the measurements/sims 😀 Room is the friend and foe.
Hi guys, coming over from “the other thread”, here’s a couple of (maybe self evident) points I believe we all forget, phase and time are not the same and temporal information cannot be gained from steady state measurements.
Hi, yeah perhaps there is lack of knowledge, will follow how it turns out. This was interesting excersice with the graphs though 🙂
Hi @airvoid,
I agree that steady-state frequency response measurements do not explicitly bring out any artefacts in the time domain.
But I think the frequency response does give us some indications (however small it might be), especially about the presence of some resonances.
But I agree that, these sort of things are better studied with a measurement which focusses more on the time domain.
For example, here is the above graph with frequency response-related information

Here is an REW spectrogram (burst decay) of the same measurement

Whatever happens around 2-3k is not much visible from the frequency response I think. But the dips in frequency response around 6.5kHz & 9.3 kHz does show up in the spectrogram as well indicating some resonances (I think).
Then there is the entire question about the resolution of the spectrogram, as there is the uncertainity principle (similar to Heisenberg's uncertainity principle) that governs the time-frequency resolution. As and when we try to have more resolution in the frequency domain, we lose the resolution in the time domain since we have to integrate the signal over the entire duration of its existence as per the Fourier transform integral.
I still don't know what is an acceptable comprise between all of the factors above. 😀 (maybe, from a DIY point of view, a measurement with large enough gate duration is good enough?)
Please let us know your thoughts on what all need to be considered from temporal information point of view and if there is a better method for studying it.
There was some very interesting discussion about related aspects here:
https://www.diyaudio.com/community/threads/vituixcad.307910/post-6945896
I agree that steady-state frequency response measurements do not explicitly bring out any artefacts in the time domain.
But I think the frequency response does give us some indications (however small it might be), especially about the presence of some resonances.
But I agree that, these sort of things are better studied with a measurement which focusses more on the time domain.
For example, here is the above graph with frequency response-related information
Here is an REW spectrogram (burst decay) of the same measurement
Whatever happens around 2-3k is not much visible from the frequency response I think. But the dips in frequency response around 6.5kHz & 9.3 kHz does show up in the spectrogram as well indicating some resonances (I think).
Then there is the entire question about the resolution of the spectrogram, as there is the uncertainity principle (similar to Heisenberg's uncertainity principle) that governs the time-frequency resolution. As and when we try to have more resolution in the frequency domain, we lose the resolution in the time domain since we have to integrate the signal over the entire duration of its existence as per the Fourier transform integral.
I still don't know what is an acceptable comprise between all of the factors above. 😀 (maybe, from a DIY point of view, a measurement with large enough gate duration is good enough?)
Please let us know your thoughts on what all need to be considered from temporal information point of view and if there is a better method for studying it.
There was some very interesting discussion about related aspects here:
https://www.diyaudio.com/community/threads/vituixcad.307910/post-6945896
Impulse responses are not steady state.
I am never really sure what to make of the differences in display between various programs other than differences in an assumption where the impulse should start.
Here is a screenshot from rephase of 2nd order filters at 20Hz and 20K. Analytically there should be 90 degree phase shift at 20K and -90 at 20Hz which is what rephase shows.

Import that impulse into REW and the phase is not the same. Generating a minimum phase response is also different. REW wants to put the peak of the IR at time zero. This corresponds with the generated minimum phase. Offsetting the time to get back to 90 and -90 at 20 and 20K puts time zero half way up the peak.

Applying that time then makes the impulse look very different but the phase is then as it is in rephase.

An article describing these effects
https://www.prosoundtraining.com/2016/11/14/meaningful-loudspeaker-phase-response/
I am never really sure what to make of the differences in display between various programs other than differences in an assumption where the impulse should start.
Here is a screenshot from rephase of 2nd order filters at 20Hz and 20K. Analytically there should be 90 degree phase shift at 20K and -90 at 20Hz which is what rephase shows.
Import that impulse into REW and the phase is not the same. Generating a minimum phase response is also different. REW wants to put the peak of the IR at time zero. This corresponds with the generated minimum phase. Offsetting the time to get back to 90 and -90 at 20 and 20K puts time zero half way up the peak.
Applying that time then makes the impulse look very different but the phase is then as it is in rephase.
An article describing these effects
https://www.prosoundtraining.com/2016/11/14/meaningful-loudspeaker-phase-response/
Talking about which songs to use for evaluation, it seems we've got to start listening to ABBA,
Judging by the first CD at this link 😉.
Judging by the first CD at this link 😉.
That depends on where the reference time is set. If I set it to 170.675ms the same as rephase the phase is -90 +90 at 20 and 20K, if I get the reference time which puts it at the impulse peak (170.688ms) then the upper phase goes flat. A difference of 0.013ms or less than 1/2 a sample. Images attached.Fluid if you take that impulsen into vituixcad, and do the IR2FR what is the result?
Attachments
I have read the prosound article, very interesting. Note that in Arta you can show the dots of the impulse, by zooming in.
I already was doing that , because i ran into phase diff's like @fluid demonstrated (i do not use rew, only arta and vituixcad) and is why i nowadays measure drivers with 96khz sample rate.
Does not mean i understand it fully yet.
I already was doing that , because i ran into phase diff's like @fluid demonstrated (i do not use rew, only arta and vituixcad) and is why i nowadays measure drivers with 96khz sample rate.
Does not mean i understand it fully yet.
- Home
- Loudspeakers
- Multi-Way
- A 3 way design study