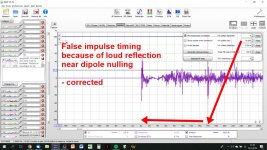
On-axis simulated response and in-room LP measured response are two different things. (Sub)woofer's radiation is always more or less reflected and amplified from adjacent wall and floor, but making that show up in measurements if tricky. Wavelet decay and impulse/step response help to find it out. Often reflected bass impulse has higher amplitude and always time lag to direct sound. When measuring a dipole radiatro at 60-120 deg, check impulse in measurement software! REW wants to set time=0 to highest impulse peak, but user can adjust that.
A good example of this is at Atkinson's report of Gradient Helsinki, which hass dipole bass at 90deg to mid/tweeter. Gradient Helsinki 1.5 loudspeaker John Atkinson, November 2010 | Stereophile.com
Gradient Revolution's dipole bass can be rotated... Atkinson's follow-up Gradient Revolution loudspeaker John Atkinson March 1997 | Stereophile.com
Those were interesting reads. He measures the dipole woofer indoors.
I went to my 18" outdoor measurements on REW and into the Impulse tab. Indeed, the peak is set at time=0.


But this is of course measured outside. Should I measure indoors? That would be good! Would save me a lot of time hauling stuff to the rooftop!
Not sure what is it I would be looking for, though.
Outdoor and indoor measurements are two different things! Atkinson's indoor measuements are always RTA with noise, and that means it is just spl.
But we don't hear only total spl of bass like RTA, delay of direct sound vs. reflected, phase shifts and modes can be found with modern FFT analysis (REW, ARTA), and we can see more data about what happens when a dipole bass radiator is rotated in a room. I bet it can also be heard with music, at least from 100Hz up in a rather large and acoustically sane room (lowish RT)
So, just more tests indoors, listening and measuring -->learning! This is your hobby, right? 😎
Here image of timing failure at 90deg measurement indoors
Attachments
Last edited:
LewinskiH01 ... could be the outdoor environment contributing to the nulls effect. That and the baffles width/height ratio.
I'm wondering if the concrete surroundings influenced the frequencies below the null ... then the baffle width/height rolls off the response around the null frequencies ... then the drivers get back on baffle and into beaming above the null.
You could experiment with baffle shapes to see if the effect remains. Maybe an hourglass shape with the horn at the narrower section.
Last edited:
Yes, back to responses,
The turntable plate and tweeter horn (and box on backside) make extra baffle for midranes, making response different from simulation. Even more effect on backside measurements!

But I don't think there is a big problem with that, eq takes care on frontside response and backside will be another story anyway and less meaninful regarding how it sounds. Tweeter's backside radiation will be much more irrgular for sure!
Next thing is to equalize the resonse and set xo highpass. Then test how distortion rises in low end. That will determine how low you can make them go with xo.
The turntable plate and tweeter horn (and box on backside) make extra baffle for midranes, making response different from simulation. Even more effect on backside measurements!
But I don't think there is a big problem with that, eq takes care on frontside response and backside will be another story anyway and less meaninful regarding how it sounds. Tweeter's backside radiation will be much more irrgular for sure!
Next thing is to equalize the resonse and set xo highpass. Then test how distortion rises in low end. That will determine how low you can make them go with xo.
Yes, back to responses,
The turntable plate and tweeter horn (and box on backside) make extra baffle for midranes, making response different from simulation. Even more effect on backside measurements!
Great point. I hadn't thought about that!
But I don't think there is a big problem with that, eq takes care on frontside response and backside will be another story anyway and less meaninful regarding how it sounds. Tweeter's backside radiation will be much more irrgular for sure!
Tweeter back response isn't too bad. I had it measured back in #120. Now it has the additional back leg in front, but it's relatively narrow so hopefully not affecting that much
Next thing is to equalize the resonse and set xo highpass. Then test how distortion rises in low end. That will determine how low you can make them go with xo.
OK, will try this path. Maybe I'm making an issue out of a non-issue.
I can measure in-room in the lower end (around 300Hz) and test distortion. Having established the midbass to midrange xo, create the digital xo and correction filters.
And I'll need to experiment with the midbass position per the Gradient reviews. 90°, 45° to back wall, close to back wall or further out. Still need to get my head around this.
MTM should be easier to get settled with, and buy the additional two 8" so I can even have two speakers to listen to! 😀
I went ahead and measured the MTM from 200Hz, especifically thinking about distortion. I used Uli Brueggemann's approach to measure distortion using Acourate, and Uli mentioned measuring indoors was fine so I did.
This time around I did take a picture of the setup:

Distortion with both 8PE21 playing 200 to 3000Hz:

And zoomed in to look 200 to 500Hz:

Is the rise in k2 around 350Hz of concern? Or the one on k3 centered around 380Hz? From this angle a xo at 400Hz might be better, but it might be too high for the 18".
The response suggests 325Hz xo would be where the uprising slope on the low end equals the null at 800Hz:

Where do you think I should cross over from the 18"?
This time around I did take a picture of the setup:
Distortion with both 8PE21 playing 200 to 3000Hz:
And zoomed in to look 200 to 500Hz:
Is the rise in k2 around 350Hz of concern? Or the one on k3 centered around 380Hz? From this angle a xo at 400Hz might be better, but it might be too high for the 18".
The response suggests 325Hz xo would be where the uprising slope on the low end equals the null at 800Hz:
Where do you think I should cross over from the 18"?
I went ahead with 325Hz for midbass to midrange xo and I'm liking it.
I'm now building the second MTM to be able to listen to a pair. And finding my way around VituixCad. Would much appreciate your input.
I loaded the REW measurements done outside for the top driver in the MTM on the open baffle, see post #166) as "8PE21 top" driver, and those for the bottom 8" as "8PE21 bottom". For the TPL-150H I used the measurements from post #120, done outside with open back with the DIY foam waveguide. I used active xo set at 325Hz and 1700Hz, noted the top 8" at +200mm on Y and bottom 8" at -200mm (I guess ear-level is 0 on Y).
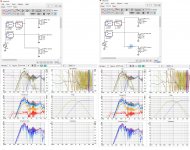
Simulation one includes both 8" playing 325 to 1700Hz:

Another simulation including a 4mH inductor before the bottom 8" so to reduce output beyond 650Hz or so and hence reduce lobbing around 1700Hz xo:

I'm learning to interpret these. I also included both scenarios combined into one file attached below.
The directivity index (red line on Power & DI chart) seems better around the xo to the TPL with the inductor, while the normal group delay (black line on GD & Phase chart) shows a hump around 1700Hz with the inductor while it's smooth without it. SPL before the 1700Hz xo is lower without the inductor than with.
I guess the most basic question is if I'm making any significant mistakes? Second would be: am I focusing on the right things?
If so, then it would seem adding the inductor to the bottom 8" would be the best approach unless the impact of GD bump is going to have a detrimental impact on sound.
Feedback very welcomed!
I'm now building the second MTM to be able to listen to a pair. And finding my way around VituixCad. Would much appreciate your input.
I loaded the REW measurements done outside for the top driver in the MTM on the open baffle, see post #166) as "8PE21 top" driver, and those for the bottom 8" as "8PE21 bottom". For the TPL-150H I used the measurements from post #120, done outside with open back with the DIY foam waveguide. I used active xo set at 325Hz and 1700Hz, noted the top 8" at +200mm on Y and bottom 8" at -200mm (I guess ear-level is 0 on Y).
Simulation one includes both 8" playing 325 to 1700Hz:
Another simulation including a 4mH inductor before the bottom 8" so to reduce output beyond 650Hz or so and hence reduce lobbing around 1700Hz xo:
I'm learning to interpret these. I also included both scenarios combined into one file attached below.
The directivity index (red line on Power & DI chart) seems better around the xo to the TPL with the inductor, while the normal group delay (black line on GD & Phase chart) shows a hump around 1700Hz with the inductor while it's smooth without it. SPL before the 1700Hz xo is lower without the inductor than with.
I guess the most basic question is if I'm making any significant mistakes? Second would be: am I focusing on the right things?
If so, then it would seem adding the inductor to the bottom 8" would be the best approach unless the impact of GD bump is going to have a detrimental impact on sound.
Feedback very welcomed!
Attachments
Why not use a single beyma 10g40 as your mid?
The 10G40 is not really a midrange. I didn't try is as such, but I recall when I purchased them as midbasses I noted Beyma recommended them as subwoofers in a ported box.
Plus a 10" mid would demand a lower xo. I did consider 18Sound 10NDA610 (back then not looking at OB), but concluded the xo was going to end up being lower than I was hoping for with the TPL. That 10NDA610 is highly efficient, purpose built as a mid, and had a feature to flatten the impedance curve which was very interesting for the SET amp, but rather expensive for a pro driver and not readily available around here.
The big plus is I have them. Had this been noted before I purchased the additional two 8", I would have tried it. But the MTM are sounding nice and I'm liking the sound of 8PE21, so don't have the itch to test the 10G40 as mids. In fact they will become ported subs in my sons bedroom 😀
I'm troubled by the null centered in 860Hz and looking for possible causes. I'm thinking I should minimize this before deciding on the inductor.
This is what I measured outside, playing only the top midrange:

I modelled the baffle as it is today vs a narrower top, just a 1cm edge around the top driver:

Blue line is the narrow top baffle. Flattens the drop after the dipole peak at 850Hz which seems would be helpful...but a null at 860Hz vs a predicted peak at the same frequency has me scratching my head.
The TPL waveguide on the front plus the box around it on the back make the real-life far from the ideal modelled, so difficult for me to understand the impact this might have. Might this create the null?

Thoughts?
Narrowing the top of the baffle seems a good idea? The plan is to have both mids playing at xo from the midbass, then have an inductor in series with bottom mid so by the time it reaches the xo to the tweeter the bottom mid output is significantly reduced and hence minimize lobbing at xo.
This is what I measured outside, playing only the top midrange:
I modelled the baffle as it is today vs a narrower top, just a 1cm edge around the top driver:
Blue line is the narrow top baffle. Flattens the drop after the dipole peak at 850Hz which seems would be helpful...but a null at 860Hz vs a predicted peak at the same frequency has me scratching my head.
The TPL waveguide on the front plus the box around it on the back make the real-life far from the ideal modelled, so difficult for me to understand the impact this might have. Might this create the null?
Thoughts?
Narrowing the top of the baffle seems a good idea? The plan is to have both mids playing at xo from the midbass, then have an inductor in series with bottom mid so by the time it reaches the xo to the tweeter the bottom mid output is significantly reduced and hence minimize lobbing at xo.
Looking at the outside results with the single top driver. That wasn't a gated response right? I keep thinking that it was a strong reflection causing the ripples. The dips and peaks corollate in frequency. 860, 1800, 3200hz .... 550, 1100, 2200hz.
Looking at the outside results with the single top driver. That wasn't a gated response right? I keep thinking that it was a strong reflection causing the ripples. The dips and peaks corollate in frequency. 860, 1800, 3200hz .... 550, 1100, 2200hz.
Correct: REW was set to automatically set windowing widths and FDW was unchecked.
How to figure out what the reflection was on? Would it make sense to measure indoors to at least see if the reflection is repeated (suggesting it's cause by something within the MTM)?
Yes, you must make many different new measurements to find out what is causing that irreglarity and deviation from sims. It can be the horn, backside structures or reflections from boundaries.
Your VCAD sim looks like there is no equalization for dipole loss, and mid is more than 10dB hot compared to the horn. You can use that 10-12dB to eq the low end of the mids so they can reach easily 300Hz xo
Your VCAD sim looks like there is no equalization for dipole loss, and mid is more than 10dB hot compared to the horn. You can use that 10-12dB to eq the low end of the mids so they can reach easily 300Hz xo
Today I set up to measure indoors, explore the null in the mids and if the box around the tweeter might be influencing, and exploring the effect of wings by the bottom midrange woofer. Lot's of stuff!
First off: how do I measure a dipoles indoors? I set the MTM on a table in the middle of the room (wide-wise), 1.2 meters (4 feet) away from the front wall (which is covered with Helmholtz resonators and fiberglass), placed the mic 2 meters away, opened the side walls to prevent reflections (white doors and glass sliding door), and placed cushions on the floor. The ceiling is absorptive too.


I wondered about using frequency dependent windowing and tried FDW=10 vs no FDW and different smoothings and found 1/6 smoothing was close:

So the rest of the measurements were done without FDW and shown here at 1/6 smoothing. All measurements done with mic on axis with tweeter and horizontally on axis.
Interesting to look at the measurements comparing both midranges playing the whole range with the TPL tweeter and box (providing a larger baffle), with wings added around the bottom woofer, and without the TPL and box with and without wings in the bottom woofer.
Here with the TPL and back box with and without wings (wings are half the with of the baffle):

Good to see the 2.5 dB increase in SPL at the bottom, and interesting to see SPL is lower than without wings above 375Hz and has less variability.
Removing the TPL and back box:

I was wondering if the TPL with the waveguide and back box would be detrimental for the midranges and was considering to try it without waveguides on the baffle thinking it might lead to a smoother response above 500Hz or so, but not really:

Keeping the TPL and back box results in higher sensitivity in the lower end and a smoother response above 500Hz - assuming no FDW and 1/6 smoothing is correct approach...
I guess the next question is whether to run the bottom midrange all the way up or include the inductor to take it out above 500Hz or so.
I also made measurements of the individual top and bottom drivers playing alone, with/without TPL, with/without wings, but haven't posted to prevent flooding you guys. But if any of those would be interesting I can include them.
Would love to get your thoughts! 🙂
First off: how do I measure a dipoles indoors? I set the MTM on a table in the middle of the room (wide-wise), 1.2 meters (4 feet) away from the front wall (which is covered with Helmholtz resonators and fiberglass), placed the mic 2 meters away, opened the side walls to prevent reflections (white doors and glass sliding door), and placed cushions on the floor. The ceiling is absorptive too.
I wondered about using frequency dependent windowing and tried FDW=10 vs no FDW and different smoothings and found 1/6 smoothing was close:
So the rest of the measurements were done without FDW and shown here at 1/6 smoothing. All measurements done with mic on axis with tweeter and horizontally on axis.
Interesting to look at the measurements comparing both midranges playing the whole range with the TPL tweeter and box (providing a larger baffle), with wings added around the bottom woofer, and without the TPL and box with and without wings in the bottom woofer.
Here with the TPL and back box with and without wings (wings are half the with of the baffle):
Good to see the 2.5 dB increase in SPL at the bottom, and interesting to see SPL is lower than without wings above 375Hz and has less variability.
Removing the TPL and back box:
I was wondering if the TPL with the waveguide and back box would be detrimental for the midranges and was considering to try it without waveguides on the baffle thinking it might lead to a smoother response above 500Hz or so, but not really:
Keeping the TPL and back box results in higher sensitivity in the lower end and a smoother response above 500Hz - assuming no FDW and 1/6 smoothing is correct approach...
I guess the next question is whether to run the bottom midrange all the way up or include the inductor to take it out above 500Hz or so.
I also made measurements of the individual top and bottom drivers playing alone, with/without TPL, with/without wings, but haven't posted to prevent flooding you guys. But if any of those would be interesting I can include them.
Would love to get your thoughts! 🙂
You're probably getting the front wall contribution now. Is it your intent to measure the speakers performance? If so, try turning the operation 90 degrees and get the mic a meter away and gate the measurement. Then you'll be able to see what the MTM arrangement is doing without too much room effect. Once they're where you're going to keep them, you can see what those issues look like compared to the "room free" measurements. At least you'll know what's what.
...and turn that table you're using 90 degrees so your measuring the narrow end.
...and turn that table you're using 90 degrees so your measuring the narrow end.
You're probably getting the front wall contribution now. Is it your intent to measure the speakers performance? If so, try turning the operation 90 degrees and get the mic a meter away and gate the measurement. Then you'll be able to see what the MTM arrangement is doing without too much room effect. Once they're where you're going to keep them, you can see what those issues look like compared to the "room free" measurements. At least you'll know what's what.
...and turn that table you're using 90 degrees so your measuring the narrow end.
So these measurements weren't useful? Ouch.
OK. So I measure along the long dimension of the room, away from front and back walls, mic 1m away from baffle, turn table to narrow side, and gate. Which FDW should I use? Is 10 OK?
It is important to position the dipole oblique to the nearest wall, to minimize reflection, or in the middle of a large room. Mic at 1m or even 60cm in your case might be good.
Then looks like you are measuring only axial response. Always take at least 30, 60 and 90 deg horizontal off-axis by rotating the speaker or mic (freehand is quick to do and ok in product developing stage, but stardardized protocol is de facto and obligatory for simulation). Vertical off-axis 5, 10,15, 30 are useful too. Then compare these to nearfield, you will see baffle contribution and also harmful reflections and interference effects.
Gating measurement analysis time(windowing) is very important. FDW means frequency-dependant windowing, and you set number of cycles. Most people don't use it, neither me so it is impossible to say which number is best. The "normal" way is to study impulse response, identify reflections (impulse peaks) and then adjust right window time (typically 4-6ms indoors). The problem is we can't then get relevant response below ~500Hz. One can set the time longer and look how response changes.
Smoothing set to 1/2 or 1/3 will show genereal trend. 1/6 to 1/48 is best to see interferences above 1kHz and to set M/T xo.
Listening spot room response is where REW's default 500ms window is ok. It will show all room modes and reflections summed.
Attachments
Last edited:
It is important to position the dipole oblique to the nearest wall, to minimize reflection, or in the middle of a large room. Mic at 1m or even 60cm in your case might be good.
Then looks like you are measuring only axial response. Always take at least 30, 60 and 90 deg horizontal off-axis by rotating the speaker or mic (freehand is quick to do and ok in product developing stage, but stardardized protocol is de facto and obligatory for simulation). Vertical off-axis 5, 10,15, 30 are useful too. Then compare these to nearfield, you will see baffle contribution and also harmful reflections and interference effects.
Gating measurement analysis time(windowing) is very important. FDW means frequency-dependant windowing, and you set number of cycles. Most people don't use it, neither me so it is impossible to say which number is best. The "normal" way is to study impulse response, identify reflections (impulse peaks) and then adjust right window time (typically 4-6ms indoors). The problem is we can't then get relevant response below ~500Hz. One can set the time longer and look how response changes.
Smoothing set to 1/2 or 1/3 will show genereal trend. 1/6 to 1/48 is best to see interferences above 1kHz and to set M/T xo.
Listening spot room response is where REW's default 500ms window is ok. It will show all room modes and reflections summed.
Thank you!!
Before re-measuring I want to insure I'm getting it right: upon measuring I should not use FDW, and then apply windowing per your example above. BTW, thanks so much for going into the trouble of laying that out for me!!
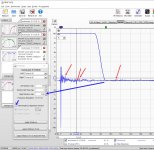
Testing it with the measurements taken yesterday, using one from the last chart in the post showing top + bottom drivers with TPL and back box in place and wings around the bottom woofer. Yesterday I displayed it at 1/6 smoothing, while here it's at 1/12:

Applying your same values in IR Windows and applying 1/48 smoothing:

First two things that jump at me are the change in shape and the SPL level...it dropped to 26dB?
What conclusions/hypothesis can I draw from this?
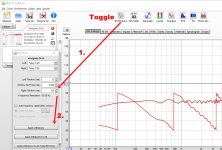
I switched to the impulse view, and think figured out most of what I was supposed to do, but my graph doesn't look like yours: it's missing the blue line going from 100% down to the measurement. What did I miss?

Are the areas with arrows reflections I should be looking into?
I went ahead and applied FDW:

Not sure what this is telling me beyond the graph without FDW?
Again, thanks so much for taking the time to walk me through all this! Lots of learning. Want to have a better grip before going into measuring again - hopefully today.
- Blue lines appear when you move the pointer(mouse) on the graph
- you must press "Apply Windows" after setting the gating time, to make it happen for that measurement, Apply Windows to All", but these settings are not saved automatically
Gating and smoothing can always be changed after taking the measurement. Default gating and smoothing parameters are given in REW Preferences window, subtitle "Analysis"
I don't know about spl change, I have not used FDW
Learning takes time, be patient! And English isn't my first language either...
Yeah, English isn't me first language either, but I think we are good enough on that 🙂
My measurements were taken with no FDW, with automatic windowing widths per REW. And then I applied the the windowing through IR Windowing, per your guidance.
What should I be looking at following this chart (same as above)?

I'll try to rearrange the setup today and take some measurements taking into account earlier guidance. The listening area is 5x5m, but the white doors open to another 5m so in total 5x10m. I will position the speaker pointing along the long axis, with 7m behind it, mic at 1m, and sliding window behind mic open. That should minimize reflections from front and back walls. And side wall reflections should be minimized by the dipole pattern having nulls at 90°, plus absorptive walls. Most challenging is ceiling/floor reflection.
My measurements were taken with no FDW, with automatic windowing widths per REW. And then I applied the the windowing through IR Windowing, per your guidance.
What should I be looking at following this chart (same as above)?
I'll try to rearrange the setup today and take some measurements taking into account earlier guidance. The listening area is 5x5m, but the white doors open to another 5m so in total 5x10m. I will position the speaker pointing along the long axis, with 7m behind it, mic at 1m, and sliding window behind mic open. That should minimize reflections from front and back walls. And side wall reflections should be minimized by the dipole pattern having nulls at 90°, plus absorptive walls. Most challenging is ceiling/floor reflection.
- Home
- Loudspeakers
- Multi-Way
- 3-way open baffle plus subs