You can always record nice single frequency sine plots with basically any speaker.
To get something resembling a square wave on the screen is nearly impossible
even if done in anechoic room or outdoors.
We have seen more than one threads dealing with this here.
Again, capture of a square contains a good deal of information, but since you use
an analyser also you can try to optimise the set up and find the correlation between
these two forms of representation.
Wonderful to see this great data.
That's a software o'scope? Good if we could learn more about all the pieces in the measurement loop because sometimes the faulty part is in the tool not the device being tested.
That last FT display, is it log or linear? Likely your speaker would be around .1% THD and that would be visible as -60dB on a log scale but not as 1/1000 on a linear scale. (But linear is OK for the square wave products.)
Now.... the super test is tone-bursts, near field of course. Esp for low bass, that tells a lot about speakers' transient behaviour and is easily captured in real-time as on a scope, if you can access a tone-burst signal. ESLs should really shine on that test.
Linkwitz, may he rest in peace, has excellent test tracks including a modified tone-burst of some sort, not sure if it is right.
B.
A tone burst contains information around the centre frequency and not much more.Now.... the super test is tone-bursts, near field of course. Esp for low bass, that tells a lot about speakers' transient behaviour and is easily captured in real-time as on a scope, if you can access a tone-burst signal. ESLs should really shine on that test.
Linkwitz, may he rest in peace, has excellent test tracks including a modified tone-burst of some sort, not sure if it is right.
B.
Linkwitz proposed in one of his JAES articles a simple method to do a frequency
response curve at home - "Shaped Tone Burst Testing" - I think was the title of the
paper. In the time before personal computers arrived it was hard to do plots like
this at home. It is here : JAES, Vol. 28, No. 4, April 1980
Rod Elliot wrote about it : http://sound.whsites.net/project58.htm
I built the device and modified it in a way that a "usual" square tone burst could be
generated also.
The Martin Logan ESL with 5 kHz sine, the same experimental setup as the 200 Hz square wave:
Signal of the sine wave in the amplifier input at the top, 20 mV/cm, 40 mVpp
Mid microphone signal 5 mV/cm, 6 mVpp
Down current signal 500 mA/cm, 1.25 app (output current of the amplifier into the input of the Martin Logan ESL).

As you can see, in contrast to the rectangle, there is full agreement of the waveforms of all three signals (amplifier input, amplifier output or loudspeaker input and microphone signal)
FT linear of the current signal 1.25 app, center frequency 25 kHz:

FT log of the current signal 1.25 app, center frequency 25 kHz:

Signal of the sine wave in the amplifier input at the top, 20 mV/cm, 40 mVpp
Mid microphone signal 5 mV/cm, 6 mVpp
Down current signal 500 mA/cm, 1.25 app (output current of the amplifier into the input of the Martin Logan ESL).
As you can see, in contrast to the rectangle, there is full agreement of the waveforms of all three signals (amplifier input, amplifier output or loudspeaker input and microphone signal)
FT linear of the current signal 1.25 app, center frequency 25 kHz:
FT log of the current signal 1.25 app, center frequency 25 kHz:
Hi BenToronto
"That's a software o'scope?
Good if we could learn more about all the pieces in the measurement loop because sometimes the faulty part is in the tool not the device being tested."
The FFT analyzer is a HP 3561A.
This analog scope is a Tektronix 7602 with a 7A26, 1 MOhm input, and a 7A24 50 Ohm input.
The sine and square wave generator is a HP 3310 B.
The current probe is a Tektronix P6042, the output is connected to the 7A24.
For the measurement of the high voltage amplifier output, inside the Martin Logan box, the Tektronix high voltage probes P6015 are used, connected to the 7A26.
"That last FT display, is it log or linear?
Likely your speaker would be around .1% THD and that would be visible as -60dB on a log scale but not as 1/1000 on a linear scale. (But linear is OK for the square wave products.)"
This FT display you have mentioned has a linear y-axis.
In the last new post I have presented a linear as well as a log plot of the FT current signal of the amplifier output.
Last edited:
Great equipment, nobody will quibble.
Yes, log display shows HD products around -60dB. Those super-super-sonic peaks not audible concern even if not artifactual.
'tis a brave soul who would try that kind of display at 35 Hz (say at home levels of "strong musical tone", "loud music tone" and "quite louder tone").
A classic "square" tone-burst is a defensible test tone and represents something that could arise in music. Granted, there can be some debate about how a speaker's output should look with a signal with an infinitely fast onset as the signal. But the mic seeing something looking like the tone-burst signal, that's the goal.
Same thing could be said about sharp "Dirac" pulses and if the speaker produces a peak and no "group delay" junk.
B.
Last edited:
The Martin Logan ESL with 1 kHz sine wave, the same experimental setup as with the 200 Hz square wave:
Low level signal of the sine wave in the amplifier input at the top, 5 mV/cm, 6 mVpp
Mid microphone signal 5 mV/cm, 1 mVpp
Down current signal 50 mA/cm, 60 mApp (output current of the amplifier into the input of the Martin Logan ESL).

As you can see, in contrast to the square wave, there is full agreement of the waveforms of all three signals (amplifier input, amplifier output or loudspeaker input and microphone signal)
FT linear of the microphone signal 1 mVpp, center frequency 1 kHz:

High level signal of the sine wave in the amplifier input at the top, 20 mV / cm, 40 mVpp
Mid microphone signal 5 mV/cm, 5 mVpp
Down current signal 200 mA/cm, 400 mApp (output current of the amplifier into the input of the Martin Logan ESL).

FT of the current signal 400 mApp, center frequency 1 kHz:

FT linear of the microphone signal 5 mVpp, center frequency 1 kHz:

Low level signal of the sine wave in the amplifier input at the top, 5 mV/cm, 6 mVpp
Mid microphone signal 5 mV/cm, 1 mVpp
Down current signal 50 mA/cm, 60 mApp (output current of the amplifier into the input of the Martin Logan ESL).
As you can see, in contrast to the square wave, there is full agreement of the waveforms of all three signals (amplifier input, amplifier output or loudspeaker input and microphone signal)
FT linear of the microphone signal 1 mVpp, center frequency 1 kHz:
High level signal of the sine wave in the amplifier input at the top, 20 mV / cm, 40 mVpp
Mid microphone signal 5 mV/cm, 5 mVpp
Down current signal 200 mA/cm, 400 mApp (output current of the amplifier into the input of the Martin Logan ESL).
FT of the current signal 400 mApp, center frequency 1 kHz:
FT linear of the microphone signal 5 mVpp, center frequency 1 kHz:
Good stuff physikfan ! I really enjoy measurements and measurement gear too.
You inspired me to go grab some square wave captures from an Acoustat-X with a Servodrive amp, and then also from a recent multiway I've been working on.
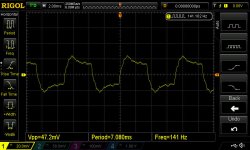
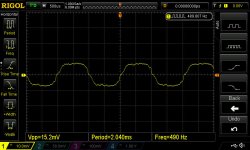
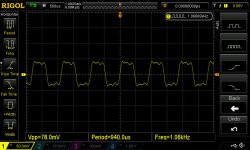
First the Acoustat...
you can see the freq on each screen grab.
Frequencies are 80, 141, and 490 Hz.
Beyond 500Hz, there wasn't much "square" left to see in the wave 🙂
I tried the mic (isemcon7150) 2 inches away from the center panel, and at about 1 meter. Results slightly favored 1 meter.
Next set is a 3-way that is designed to sit on a sub. 12" mid, and a coaxial CD on a horn.
Frequencies are 141, 387, 641, & 1060Hz.
These were kinda 'handpicked' as I manually swept thru. As anybody knows whose done square wave testing, the results vary alot freq by freq.
I really like Bwaslo's you tube sweep...very cool, fair way to look at square waves i think. I need to learn how to post such.
Ok, change of plans...I'm only putting the Acoustat picts in this post.
I'll imediately post the DIY right after this...I afraid I might make too much trace confusion if all put together in this post ...
You inspired me to go grab some square wave captures from an Acoustat-X with a Servodrive amp, and then also from a recent multiway I've been working on.
First the Acoustat...
you can see the freq on each screen grab.
Frequencies are 80, 141, and 490 Hz.
Beyond 500Hz, there wasn't much "square" left to see in the wave 🙂
I tried the mic (isemcon7150) 2 inches away from the center panel, and at about 1 meter. Results slightly favored 1 meter.
Next set is a 3-way that is designed to sit on a sub. 12" mid, and a coaxial CD on a horn.
Frequencies are 141, 387, 641, & 1060Hz.
These were kinda 'handpicked' as I manually swept thru. As anybody knows whose done square wave testing, the results vary alot freq by freq.
I really like Bwaslo's you tube sweep...very cool, fair way to look at square waves i think. I need to learn how to post such.
Ok, change of plans...I'm only putting the Acoustat picts in this post.
I'll imediately post the DIY right after this...I afraid I might make too much trace confusion if all put together in this post ...
Attachments

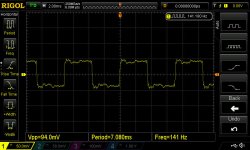
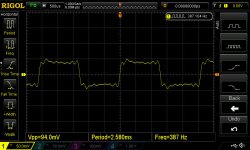
Ok, here the DIY captures..straight on-axis at about 1 meter.
As said they are 141, 387, 641, & 1060Hz.
And again, they represent kinda best case looking waves (done w FIR),
although a sweep does hold form pretty dang well throughout....
well enough that I'm a quite a happy camper 🙂
As said they are 141, 387, 641, & 1060Hz.
And again, they represent kinda best case looking waves (done w FIR),
although a sweep does hold form pretty dang well throughout....
well enough that I'm a quite a happy camper 🙂
Attachments

...As you can see, in contrast to the square wave, there is full agreement of the waveforms of all three signals (amplifier input, amplifier output or loudspeaker input and microphone signal)...
Good to see. Again thanks.
But one can't eyeball the error in a sine wave on a scope, sometimes not below even 10%. The FT on log display does reveal the garbage.
BTW, while it may seem like a log display unduly emphasizes the otherwise small garbage, it usually reflects human experience better.
B.
A speaker would have to be quite distorted to NOT appear visually as a sinewave shape when driven with a sinewave! When only one frequency is applied, only one should come out except at quite low levels relatively.
With many speakers it is possible to get a squarish looking reproduction of a square wave at a single test frequency, but to be 'transient perfect' it has to be doable over a range of frequencies, at least up to 4kHz or so (because a square wave is all odd harmonics and above 4kHz the 5th and higher harmonics are above hearing range of nearly all but very young people). Here's a downloadable WAV file of a square wave sweep that can be used with a good flat response microphone and an edge triggerable oscilloscope:
http://libinst.com/SynergyCalc/squarewave%20sweep.wav
All that said, I don't think 'transient perfect' is a goal worth pursuing other than for fun. I did tests at an audio club meeting, playing a 3-way coaxial speaker, higher order crossover, that was FIR eq'd for decent wide range square wave response fidelity. Most said they couldn't hear any difference in the EQ'd and the non-EQ'd playback and of those that said they did, half preferred the non-EQ'd. No one there, me included, thought the difference was more than subtle at best.
Last edited:
All that said, I don't think 'transient perfect' is a goal worth pursuing other than for fun. I did tests at an audio club meeting, playing a 3-way coaxial speaker, higher order crossover, that was FIR eq'd for decent wide range square wave response fidelity. Most said they couldn't hear any difference in the EQ'd and the non-EQ'd playback and of those that said they did, half preferred the non-EQ'd. No one there, me included, thought the difference was more than subtle at best.
Hi, not meaning to hijack/swerve too far....
But the 3-way at the audio club...
was the FIR eq applied globally.. to the total speaker output?
or applied driver-by-driver with linear crossovers, with no further speaker correction needed?
Just asking because I find global FIR eq isn't worth the trouble AT ALL (and is the most common application of FIR eq).
But IME, driver-by-driver FIR along with linear crossovers, is a remarkable improvement.
It was global. Why do you think individual is better (assuming the crossover points, slopes, and overall response magnitude shape were the same)?
It was global. Why do you think individual is better (assuming the crossover points, slopes, and overall response magnitude shape were the same)?
Biggest reason is just like you and your audio club friends, I can't hear much difference with global.
I do know I hear real improvements with individual.
I 'think' it's due to several reasons....
Global correction attempts to correct acoustic summations between drivers, but those frequency regions are no longer minimum phase, and my understand is basically not correctable post-summation (other than to a spot)
I think taking the time to individually flatten the mag and phase of drivers in their passbands and also their summation regions, reduces the non-minimum phase behavior of the drivers' acoustic summation down to just geometry.
Individual phase flattening through crossover region (via out of band IIR EQ) is a great plus I think.
I've seen with global correction, that frequency response measurements vary noticeably more with small on-axis mic position changes, and vary alot more with off-axis measurements....than compared to individual correction.
Same thing, with phase measurements, even more so.
Impulse peaks are invariably higher with individual.
I find when I take the time to do individual FIR, I can go all-in with meticulous IIR driver mag and phase flattening, as well as using steep complementary linear phase crossovers .....
which REALLY help to minimize driver flattening needs, as well as improve off-axis response.
Global FIR is easy, but IME it's like trying to fix the look of a crooked posture with a crooked mirror.
It's a lot of work to do individual, but I'm truly enjoying the gains in clarity, dynamics, imaging, etc.
Measurements show it too...be they simple transfers, impulse, step, square waves...I mean heck, they're all the same thing, just different looks, aren't they..🙂
- Status
- Not open for further replies.
- Home
- Loudspeakers
- Planars & Exotics
- 200 Hz square wave into an ESL analyzed by a HP3561A