😍 😉
This a fork inspired by a post by @hifijim following his inspired thread on measurements that matter, except we all got into the weeds for the first 10 pages...all about impedance traces...
So to clear the air, I thought we could play the Impedance plot game:
Rules:
Maximum 2 sweeps per graph.
Phase is included, but if graphs get too busy, I can remove them.
1 Logarithmic Y scale MUST be included (allows one to view high and low values simultaneously)
A zoomed in trace may be requested (optional)
No red/green traces please (for our red/green colour impaired friends)
Winners:
Correctly guesses the reason for the difference between the two traces. Close enough is good enough...
GOLDENEYE award- correctly understands the difference between the two traces.
SCIENTIFIC COMMUNICATOR AWARD - explains why, in lay terms, for the differences, so that we can all follow along.
eg. "This trace is a of a subwoofer, because of the peak in the graph is at a low frequency ie. 23Hz. Is it a very high peak, because... . The double peaks and the saddle in between them at 38 Hz suggests that this is.... The discontinuity at ~170Hz suggests either... however we need more information on the..."
I'll be adding to this this list as I collect more. Please feel free to add your own for the diyAudio brains trust to help solve your impedance plot problems... Remember, the only way to learn is to make mistakes. So feel free to have a go!
First up:

GOLDENEYE! for @PKAudio's post. How did he do it? Any Scientific Communicators among us?
previous Leading scorer: @stv, partially correct on both traces. very close- please try again!
ITEM 2:

GOLDENEYE award to @mbrennwa . Yes, correct on all counts. But why only possibly in a sealed box? Was there any doubt? And why/why not? What happens when one omits damping?
ITEM 3: courtesy @Hörnli

ITEM 4: same product, different samples.


2nd graph courtesy of John Krutke
ITEM 5: Coming up....
PS. Once you win a prize, please go to the end of the line and wait for other people have a go. Better yet, post your own confusing/tricky plots for us to play/learn from....
This a fork inspired by a post by @hifijim following his inspired thread on measurements that matter, except we all got into the weeds for the first 10 pages...all about impedance traces...
So to clear the air, I thought we could play the Impedance plot game:
Rules:
Maximum 2 sweeps per graph.
Phase is included, but if graphs get too busy, I can remove them.
1 Logarithmic Y scale MUST be included (allows one to view high and low values simultaneously)
A zoomed in trace may be requested (optional)
No red/green traces please (for our red/green colour impaired friends)
Winners:
Correctly guesses the reason for the difference between the two traces. Close enough is good enough...
GOLDENEYE award- correctly understands the difference between the two traces.
SCIENTIFIC COMMUNICATOR AWARD - explains why, in lay terms, for the differences, so that we can all follow along.
eg. "This trace is a of a subwoofer, because of the peak in the graph is at a low frequency ie. 23Hz. Is it a very high peak, because... . The double peaks and the saddle in between them at 38 Hz suggests that this is.... The discontinuity at ~170Hz suggests either... however we need more information on the..."
I'll be adding to this this list as I collect more. Please feel free to add your own for the diyAudio brains trust to help solve your impedance plot problems... Remember, the only way to learn is to make mistakes. So feel free to have a go!
First up:
GOLDENEYE! for @PKAudio's post. How did he do it? Any Scientific Communicators among us?
previous Leading scorer: @stv, partially correct on both traces. very close- please try again!
ITEM 2:
GOLDENEYE award to @mbrennwa . Yes, correct on all counts. But why only possibly in a sealed box? Was there any doubt? And why/why not? What happens when one omits damping?
ITEM 3: courtesy @Hörnli
ITEM 4: same product, different samples.
2nd graph courtesy of John Krutke
ITEM 5: Coming up....
PS. Once you win a prize, please go to the end of the line and wait for other people have a go. Better yet, post your own confusing/tricky plots for us to play/learn from....
Last edited:
At first sight, the attachment looks like a solid black rectangle with nothing else (on my phone, see screenshot). Zooming into the black mass of nothingness shows some very faint dark red lines. Also some minuscule axis labels, again hardly readable. Hard to see the data and impossible to get an overview in deep zoom.
Can you provide a proper, easy to read plot?
Can you provide a proper, easy to read plot?
Attachments
Very nice idea!
I'll give it a try.
It's a 6 ohm-midrange driver, probably free air (no enclosure resonance wiggles visible). Low inductance.
There seems to be a higher temperature (or added resistance) for the purple trace. Identical wiggles above 1 kHz indicate identical cone (?) or suspension resonances.
Some strange wiggles between 200-300 Hz for the blue trace might be result of not perfectly attached added mass ...
ITEM1:
Faital Pro 4FE42, blue free air, magenta in closed box stuffed with damping material as there are no additional irregularities.
Blue: mild wiggles 200-300Hz, the driver was not properly fixed during impedance sweep? Maybe held in the hand?
Faital Pro 4FE42, blue free air, magenta in closed box stuffed with damping material as there are no additional irregularities.
Blue: mild wiggles 200-300Hz, the driver was not properly fixed during impedance sweep? Maybe held in the hand?
That's what I wanted to say, but now I am too late.Some strange wiggles between 200-300 Hz for the blue trace might be result of not perfectly attached added mass
ITEM-2: purple is a woofer in free air (or a very large enclosure, but then I'd expect to see some wiggles from standing waves in a large box). Blue/red is the same driver, but with a lot of damping, possibly in a sealed box.
Last edited:
It could have been an aperiodic damped box. They sometimes look like a low-Q sealed boxBut why only possibly in a sealed box? Was there any doubt?
@tktran303 : You may just "steal" it, give it an ITEM number and put it in your nice opening?
"ITEM 108 #8" until then...

"ITEM 108 #8" until then...
Last edited:
That's a weird one, see previous discussion here (and the follow up posts)."ITEM 108 #8" until then...
ITEM 108 #8
As I think about how many clues to give, the speaker plays music that I like. Okay, two of them. There's nothing strange about that. Maybe a little low in [published😉] nonlinear harmonic distortion.That's a weird one
Impedance is almost flat, and so it makes sense that phase is almost flat, too.
What is unusual is that impedance is rather high (25...30 Ohm) and almost perfectly flat (within +/- 1.5 Ohm up to 2 kHz). Why is that?
I will never receive such a prestigious award 😢SCIENTIFIC COMMUNICATOR AWARD
Best regards
Bernd
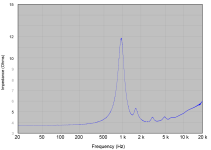
my guess for ITEM4:
a tweeter, supposedly a dome tweeter with a small resonance peak caused by lack of dampening for back-chamber and/or behind-voice-coil-gap air volume resonance.
I once created something similar that by removing ferrofluid and increasing a tweeter back chamber by drilling the pole piece.
speaking of tweeters - here is a very strange impedance plot I measured some time ago:

I was quite puzzled but finally realized what was going on.
a tweeter, supposedly a dome tweeter with a small resonance peak caused by lack of dampening for back-chamber and/or behind-voice-coil-gap air volume resonance.
I once created something similar that by removing ferrofluid and increasing a tweeter back chamber by drilling the pole piece.
speaking of tweeters - here is a very strange impedance plot I measured some time ago:

I was quite puzzled but finally realized what was going on.
An aluminum dome tweeter with a crushed dome? The material has to be stiff to get the relatively high Q resonance, so no soft doped cloth dome? And the out of phase crushed part has to be heavy enough to copy into the impedance, so not a small dent, more a total wreck?ITEM 4
EDIT: A loose glue joint between dome and coil?
EDIT2: A spilled blob of glue on inside of the dome?
EDIT3: return for refund :-(
OK, your graph has a very high resolution with its logarithmic scale.
The manufacturers show "no resolution" linear scales.
Maybe start a conversation with the manufacturer?
Did you buy only one?
Last edited:
Yes, indeed! Impedance peak at john krutke's version has only 9 ohm peak. And there still seems to be a slight impedance elevation around 2,5 kHz?different samples.
What would you do?
If it's cheap and possible I would open it carefully and check the dampening material (if there is any), eventually test melamine foam shaped to not touch the dome - for science.
But if it's an expensive part definitely best to send it back for replacement.
https://www.diyaudio.com/community/threads/drive-current-distortion-measurement.402566/That's a weird one, see previous discussion here (and the follow up posts).
#81 there
"volume: 100l
fill: 4,375 kg sonorock (idea: Esa Meriläinen)
resistor: 20R"
Best regards
Bernd
Dismantling mean breaking glue lines, so it was probably never designed to be repaired. And thus low cost.
But @stv you get GOLDENEYE award. Indeed poor damping or mis-damping is a common reason for dual impedance peaks. I've experienced this in the past with a different tweeter, where I replaced the voice coil/dome assembly but didn't reassemble it correctly.
But @stv you get GOLDENEYE award. Indeed poor damping or mis-damping is a common reason for dual impedance peaks. I've experienced this in the past with a different tweeter, where I replaced the voice coil/dome assembly but didn't reassemble it correctly.
Transmission line behaviour of ported tweeter?speaking of tweeters - here is a very strange impedance plot I measured some time ago:
View attachment 1289131
I was quite puzzled but finally realized what was going on.
First wiggle at about 1.7 kHz, second wiggle at about 3.1 kHz, third wiggle at about 4.9 kHz (and a fourth wiggle at 6.5 kHz?). Wavelengths are 20 cm, 11 cm, 7 cm (and 5 cm?). Acoustic reflection with a nearby surface 10 cm away from the tweeter?
- Home
- Loudspeakers
- Multi-Way
- Impedance sweep - HOT or not?
