Hans measured with periodic patterns and with shaped noise, what advantage would white noise have?
If this is the case then the effect of crosstalk will persist even if another device like JLSounds isolated is used?This was measured directly on the Firdac board where the Amanero’s signals are entering.
But Marcel makes valid point that because of capacitive coupling the data can push the clock up and down.
That could explain why a 010101.. pattern gives the same S/N independent of DSD rate, but that a real DSD512 signal with rather chaotic switching from between zero and one is so much worse as at lower rates.
Hans
Only Hans can explain why he used the stimulus he used, but my reasoning was that if you don`t know what kind of signal triggers it, it seems best to use all frequencies.
The bursts are to simulate many music signals that envelope and fade fast, hence a stepped or burst white noise signal.
why shape it any way at all?
Edit: wouldn`t higher audio frequencies capacitively couple stronger, so that signal would prove interference easier?
The bursts are to simulate many music signals that envelope and fade fast, hence a stepped or burst white noise signal.
why shape it any way at all?
Edit: wouldn`t higher audio frequencies capacitively couple stronger, so that signal would prove interference easier?
Last edited:
With shaped noise, you can see if any noise ends up in the band that is supposed to be almost free of it. With white noise, you see noise at all frequencies no matter whether the DAC works well or poorly.
ah, i see you`re testing the audio output, I was thinking of analyzing the clock signal, not the dac;-)
I don't know if Hans or bohrok2610 have access to a good RF spectrum analyser or some other equipment you can use to check the spectral purity of clock signals. I certainly haven't in my spare time (and the ones at work are used for work).
If its really necessary, there is a tiny VNA here...and, um, let's see,...an HP 8753D, OPT. 006, network analyzer left here for the boys in Auburn when Richard Marsh departed for Thailand. Haven't read the manual yet on that one, so not sure how much good it might be in this case. Also not sure what kind of shape its in at the moment or what connector adaptors we have. It came with some adapters and there are some other ones around I keep on hand, but would have to check.
Last edited:
Not to be filed under low hanging fruit just yet, right?!
If needed, couldn`t it be done with a 1st order 20 Hz high pass filter, some steep low pass 20K, then a LNA and a soundcard or something similar?
If needed, couldn`t it be done with a 1st order 20 Hz high pass filter, some steep low pass 20K, then a LNA and a soundcard or something similar?
You can check the noise at the audio output with that, but Hans, bohrok2610 and I already have equipment to do so. If you would want to measure the bit clock, you would like to know what noise and tones there are from, say, 50 kHz to 1 GHz, besides the harmonics of the bit clock.
Even with a spectrum analyser, it would be far from trivial. You would have to connect the spectrum analyser such that you know for sure the spurious tones and noise are not picked up by the connection to the spectrum analyser. I would probably solder a small semirigid coaxial cable to the top side of the board, somewhere close to the clock line but not right next to the connector, and connect its centre conductor to the clock line via a physically small resistor, making sure to keep loop areas as small as possible, and hope for the best.
Even with a spectrum analyser, it would be far from trivial. You would have to connect the spectrum analyser such that you know for sure the spurious tones and noise are not picked up by the connection to the spectrum analyser. I would probably solder a small semirigid coaxial cable to the top side of the board, somewhere close to the clock line but not right next to the connector, and connect its centre conductor to the clock line via a physically small resistor, making sure to keep loop areas as small as possible, and hope for the best.

To make a histogram of the clock’s jitter having a risetime of ca. 1.5 nsec, you would need a scope with a sampling rate >2GS/s, a very low jitter internal clock in the sub picosecond range and with built in statistics to measure deviation from the mean clock period over a few million samples.
The Teledyne WavePro is such a scope.
Not exactly in the category DIY equipment. 😆
Hans
The Teledyne WavePro is such a scope.
Not exactly in the category DIY equipment. 😆
Hans
Data dependent or capacitive/inductive coupled interference would probably show up as sidebands around the fundamental with normal FFT or J-test measurements. If the noisefloor is low and no sidebands visible what's the concern here?
What you call a “normal” FFT would also have to be sampled in the GS/s with millions of samples to make the filter bin small enough to detect sidebands, true ?Data dependent or capacitive/inductive coupled interference would probably show up as sidebands around the fundamental with normal FFT or J-test measurements. If the noisefloor is low and no sidebands visible what's the concern here?
Hans
Data dependent or capacitive/inductive coupled interference would probably show up as sidebands around the fundamental with normal FFT or J-test measurements. If the noisefloor is low and no sidebands visible what's the concern here?
When you look at the audio spectrum at the DAC output, you only see sidebands around the signal for close-in amplitude or phase noise. The far-off noise and spurs will affect the audio noise floor or mix tones into the audio band.
@mterbekke can answer why he would like to have the clock checked, I guess as an extra test that the noise floor depends on the purity of the clock. In my opinion, there is enough indirect evidence for that. It's also expected from theory.
Yes, but why wouldn't the affected audio noise floor or mixed tones show up in FFT measurement? J-test signal is supposed to stimulate data jitter so it could be used instead of normal single tones.When you look at the audio spectrum at the DAC output, you only see sidebands around the signal for close-in amplitude or phase noise. The far-off noise and spurs will affect the audio noise floor or mix tones into the audio band.
For audio band measurements 32M FFT is supported in some audio analyzer SW (e.g. Multitone Analyzer). So for 48kHz fs a recording of 15 minutes should provide enough samples for 32M FFT.What you call a “normal” FFT would also have to be sampled in the GS/s with millions of samples to make the filter bin small enough to detect sidebands, true ?
@MarcelvdG If the assumption is that crosstalk influences the clock signal, which will raise the noise floor, proving the noise floor is raised still needs proof the clock is actually effected, and not some other mechanism is at work. Otherwise we assume nothing else could be causing it.
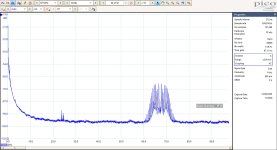
The FFT image below show the effect of extreme jitter of a SMPS supply
To do the same with the BCLK to show jitter in the low psec range, would need a huge FFT sampling in the GS/s range.
My scope goes in FFT mode just to 100Mhz with 0.25GS/s with 16.384 samples, giving a filter bin width of 6.104 Khz, completely inadequate for the job.
Hans
To do the same with the BCLK to show jitter in the low psec range, would need a huge FFT sampling in the GS/s range.
My scope goes in FFT mode just to 100Mhz with 0.25GS/s with 16.384 samples, giving a filter bin width of 6.104 Khz, completely inadequate for the job.
Hans
Attachments
- Home
- Source & Line
- Digital Line Level
- Return-to-zero shift register FIRDAC