Make sure there's a report activated in the script, even if as an empty section:
Report = {
}
Report = {
}
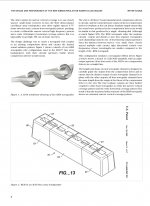
Documenting an asymmetric device which is 265 mm by 201, radiating 100 degree horizontal and 80 vertical.
I had another go, further cutting back termination and reducing the parameter q for horizontal axis. Termination-wise, it's getting more close to something like an 18sound XT1086 now.
Dimensions: Final width x height = 265.7 x 194.5 mm (10.461 x 7.658") Final length = 79.0 mm (3.110")


I was successful in avoiding too strong waist-banding effects. If the diagonal graph can be taken as an indication for sum of vertical and horizontal performance, this is not bad. Horizontal and vertical ripples kind of blend there:


But there is trouble on-axis. It is on-axis that suffered most from cutting back on termination. This directivity is +-50 deg horizontal, +-40 vertical and quite extended. Shifting the scale a bit shows what is going on between 1-2 dB from normalized, not too pretty:


Visible also in the SPL plots, normalized and not normalized, that close axial behaviour is suffering most:


Code:
Throat.Angle = 10.08
Throat.Diameter = 25.4
Throat.Profile = 1
Coverage.Angle = 45          -9*sin(p)^2

Length = 79
Term.s = 1.3                -0.55*sin(p)^2
Term.n = 3.2                +0.55*sin(p)^2
OS.k = 0.42                 +0.02*sin(p)^2
Term.q = 0.94 +0.042*sin(p)^21 dB of ripple on axis after equalizing to the normalization axis is hardly "trouble".But there is trouble on-axis. It is on-axis that suffered most from cutting back on termination.
Why do you think not?nope
I don't see that it would be much less accurate than using a driven surface radiating planar wavefronts as a stand-in for compression drivers when considering normalised polar data. Sure, there's going to be some stuff going on at the surface itself that would benefit from a multiphysics model, but the guys at Alcons seem to be have gotten pretty good results designing waveguides for their custom 'pro ribbon' HF devices using FEA and BEM driven by planar wave sources.
I say give it a shot, but make sure to qualify and fine-tune the model with real-world measurements. Same as any other simulation.
Ath itself cannot generate a waveguide directly with a rectangular source in it's current form. That is what he is referring to.Why do you think not?
Certainly a waveguide for a ribbon or planar driver can be designed with the aid of ABEC/AKABAK as you describe.
Example here on page 7
https://docplayer.org/109938274-Quasikoax-1-dokumentation.html
Ah ok. Can it only do circular throats, or are ellipses possible for asymmetric devices? I suppose you could just use a larger ellipsoid throat diameter to ‘start’ the waveguide further along the profile, and add an adapter section to transition to the rectangular throat?Ath itself cannot generate a waveguide directly with a rectangular source in it's current form. That is what he is referring to.
Certainly a waveguide for a ribbon or planar driver can be designed with the aid of ABEC/AKABAK as you describe.
Example here on page 7
https://docplayer.org/109938274-Quasikoax-1-dokumentation.html
A bit of extra loft work in CAD, but certainly possible.
Even before that, if we assume that the AMT has a planar output and the throat adapter is well designed in terms of maintaining this for the most part, then the rest of the Ath process would likely still be useful for checking directivity with a plane wave radiating flat piston at the initial throat.
Circular only. The profile of an axisymmetric guide can be exported with the grid options and that can be used as a guide rail between two rectangles to form a loft or any other way of doing it in CAD, but it is then more effort to generate a good mesh and interface etc. and that requires more knowledge of what goes on under the hood, instead of Ath outputting a project ready baked from the oven 🙂Ah ok. Can it only do circular throats, or are ellipses possible for asymmetric devices?
Abec has a waveguide function built in which is what I think was used in the example above.
Meyer Sound came up with a “ribbon emulation manifold” to convert a circular source into a rectangular one (see attached). I can’t see why one couldn’t do something similar in reverse, perhaps even combining it with Marcel’s ESP device which would ultimately convert a rectangular source into a spherical one.
Attachments
You also have a patent for an electrostatic speaker wave guiding device for a cylindrical output by Beveridge from 1969, which the Alcons patent cited as prior art. This one might look a little familiar 🙂

from https://patents.google.com/patent/US3668335A
The Alcons variant is much more simple (not an axisymmetric device):

Patent is here, goodies in the PDF https://patents.google.com/patent/WO2019043210A1/en
I think you could do the '32' part in Ath and make the adapter separately. If you want a nice multi stage learning project!
from https://patents.google.com/patent/US3668335A
The Alcons variant is much more simple (not an axisymmetric device):
Patent is here, goodies in the PDF https://patents.google.com/patent/WO2019043210A1/en
I think you could do the '32' part in Ath and make the adapter separately. If you want a nice multi stage learning project!
Greetings all,
I have some problems with ath-4.8.0.
First, although the manual refers to demos, they are not present, so I used the script for CE360 from Marcel's post 7,920. However the polar map does not look like the one posted,

Second, I seem to have properly set-up generation of files in the Results directory per chapter 4.1.6; however when re-running the script command with -r flag as per chapter 6.13, the script reports:
However, there is no report 2x2n.gpl to be found in the CS_360 directory, and I do not understand the last line. As best understood, the line is attempting to invoke gnuplot. In that regard, I have a correct path set in ath.cfg and I can invoke the gnuplot executable files. I am using version 5.2.8 as the latest 5.4 series has problems running on Windows 10 per the gnuplot website.
Any help would be appreciated.
Kindest regards,
M
P.S. I found that the demos are included in ath-4.7.0
M
I have some problems with ath-4.8.0.
First, although the manual refers to demos, they are not present, so I used the script for CE360 from Marcel's post 7,920. However the polar map does not look like the one posted,
Second, I seem to have properly set-up generation of files in the Results directory per chapter 4.1.6; however when re-running the script command with -r flag as per chapter 6.13, the script reports:
Code:
-destination directory: C:\...\...\CS_360
-reading BEM results
-writing report 2x2n.gpl: 'CS-360'
line 0: Cannot open script file 'C:\Program'
However, there is no report 2x2n.gpl to be found in the CS_360 directory, and I do not understand the last line. As best understood, the line is attempting to invoke gnuplot. In that regard, I have a correct path set in ath.cfg and I can invoke the gnuplot executable files. I am using version 5.2.8 as the latest 5.4 series has problems running on Windows 10 per the gnuplot website.
Any help would be appreciated.
Kindest regards,
M
P.S. I found that the demos are included in ath-4.7.0
M
Last edited:
Greetings all,
another issue, there is no explanation of the term Rollback.Exp in the manual. What does it do?
Kindest regards,
M
another issue, there is no explanation of the term Rollback.Exp in the manual. What does it do?
Kindest regards,
M
Try to avoid placing Ath in a directory containing spaces in its path. Regarding the polars, I don't know, it works fine for me.
Rollback.Exp is the speed of curvature increase. You are free to try different values, I think 1.5 is the default.
Rollback.Exp is the speed of curvature increase. You are free to try different values, I think 1.5 is the default.
Hi Marcel, all,
first, thank you Marcel for your reply.
Accordingly, I added a data drive and moved the ath-4.8.0 folder to the root of the drive, which resolved the problem with inability to open the script file.
Regretfully, this did not solve the problem with the SPL spectra, which is the same as the figure in post # 9,053. furthermore, the your report:

is different from the one produced by running your script on on my Ath installation:

In desperation, I re-read the manual, and found the following text: "When setting polar maps, always remember to set the offset properly, especially for infinite baffles." So I re-run the script with added:
- not present in your script - since the length of the wave-guide is reported as 92 mm, which does result in a different SPL map:

I am infinitely baffled.
Again, any help would be appreciated.
Kindest regards,
M
first, thank you Marcel for your reply.
Accordingly, I added a data drive and moved the ath-4.8.0 folder to the root of the drive, which resolved the problem with inability to open the script file.
Regretfully, this did not solve the problem with the SPL spectra, which is the same as the figure in post # 9,053. furthermore, the your report:
is different from the one produced by running your script on on my Ath installation:
In desperation, I re-read the manual, and found the following text: "When setting polar maps, always remember to set the offset properly, especially for infinite baffles." So I re-run the script with added:
Code:
Offset = 94I am infinitely baffled.
Again, any help would be appreciated.
Kindest regards,
M
Last edited:
M,
if you managed to have the above graph in VCAS presented to you by changing the offset, compared to the indifferent pressure map before, then this was your problem. The offset value ought to be larger than the length of the waveguide. This is a perfectly fine output of a non-normalized pressure map, usually this is the entry:
By clicking on 'Graph' in the top menu and selecting the entry "Convert curves <-> contour", you can get a representation of what the waveguide is actually doing driven by an ideal source. For a normalized output, add with another subset:
For example:
If your device is not axisymmetric, you may need to add two more for vertical and diagonal performance:
Best,
M
if you managed to have the above graph in VCAS presented to you by changing the offset, compared to the indifferent pressure map before, then this was your problem. The offset value ought to be larger than the length of the waveguide. This is a perfectly fine output of a non-normalized pressure map, usually this is the entry:
Code:
ABEC.Polars:SPL = {
  MapAngleRange = 0,90,19
  Distance = 2
  Offset = XXX
}
By clicking on 'Graph' in the top menu and selecting the entry "Convert curves <-> contour", you can get a representation of what the waveguide is actually doing driven by an ideal source. For a normalized output, add with another subset:
Code:
NormAngle = 10For example:
Code:
ABEC.Polars:SPL_hor_norm = {
  MapAngleRange = 0,90,19
  Distance = 2
  NormAngle = 10
  Offset = XXX
}
If your device is not axisymmetric, you may need to add two more for vertical and diagonal performance:
Code:
ABEC.Polars:SPL_ver_norm = {
  MapAngleRange = 0,90,19
  Distance = 2
  NormAngle = 10
  Offset = XXX
  Inclination = 90
}

ABEC.Polars:SPL_dia_norm = {
  MapAngleRange = 0,90,19
  Distance = 2
  NormAngle = 10
  Offset = XXX
  Inclination = 42
}
Best,
M
Marcel used the property setfurthermore, the your report:
(...)
is different from the one produced by running your script on on my Ath installation:
Code:
Source.Shape = 1
Source.Curv = 0
Source.Radius = -1
Source.Velocity = 1
Code:
Source.Shape = 2Hi sheeple,
thank you very much for your reply; I had been (figuratively) pulling my hair by my inability to obtain the presented results.
Based on the above-noted differences, I am now wondering, whether there is a different configuration form the one I am using. Nevertheless, I will now re-run the configuration with the changes you suggested and hopefully obtain the same results as Marcel's, which would assure me, that the program works as advertised.
The reason for my concern with the discrepancy is that I already have a wave-guide without any mouth correction, the physical dimensions of which I carefully measured and built a configuration file. I have also measured the wave-guide's SPL vs angle, so l would like to compare the results and then design the mouth correction.
Thank you once again.
Kindest regards,
M
thank you very much for your reply; I had been (figuratively) pulling my hair by my inability to obtain the presented results.
That is, what I gathered from re-reading the manual. However, I copied varbatim Marcel's configuration form post 7920. As you can ascertain, no offset is defined, yet, in his reply above, he asserted that the configuration works for him. And since he is clearly an expert with his tool, I was wondering what may be wrong with my set-up.M,
if you managed to have the above graph in VCAS presented to you by changing the offset, compared to the indifferent pressure map before, then this was your problem. The offset value ought to be larger than the length of the waveguide.
But, that directive is in Marcel's configuration file, cf. the section Results, yet my results, even after adding the offset, are different from his as per my post above.For a normalized output, add with another subset:
NormAngle = 10
Yes, I saw that in your posts; my device is axially-symmetric.If your device is not axisymmetric, you may need to add two more for vertical and diagonal performance:
Not according to the configuration that I referenced.Marcel used the property set
Source.Shape = 1
Source.Curv = 0
Source.Radius = -1
Source.Velocity = 1
I noticed the difference, however, that should not affect the high frequencies where there is a significant difference, correct?Change this and set the frequency lower minimum to 200 to get thze same result
Based on the above-noted differences, I am now wondering, whether there is a different configuration form the one I am using. Nevertheless, I will now re-run the configuration with the changes you suggested and hopefully obtain the same results as Marcel's, which would assure me, that the program works as advertised.
The reason for my concern with the discrepancy is that I already have a wave-guide without any mouth correction, the physical dimensions of which I carefully measured and built a configuration file. I have also measured the wave-guide's SPL vs angle, so l would like to compare the results and then design the mouth correction.
Thank you once again.
Kindest regards,
M
Hi sheeple,
I was able to resolve the ABEC SPL plot issue; thank you again for your help.
However, I still cannot match Marcel's published results. The two significant differences are (i) the bigger change in DI about 14-16 kHz and (ii) the throat impedance.
I wonder whether Marcel further changed the configuration vis-a-vis the published one, or whether there is regression in the code between Ath-4.7.1 referenced by Marcel's script and Ath-4.8.0. Regardless, I am rather satisfied with my progress.
Greetings all,
does anyone have Ath-4.7.1?
Kindest regards,
M
- Home
- Loudspeakers
- Multi-Way
- Acoustic Horn Design – The Easy Way (Ath4)