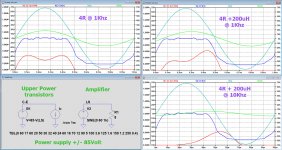
The objective is always to stay within the SOA of the output transistors.
For that purpose you could put this SOA in LTSpice in a current source with a PWL file.
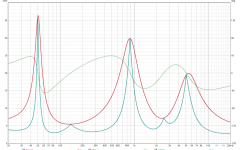
The voltage source in the simple circuit at the left bottom generates in this case 85V-V(Ls), being the VCE of the upper output transistor.
When driving the amp with whatever load, this circuit follows the SOA, in this case the blue line with V(C-E)*I(I1), while looking at the amp you get the real power dissipation in the upper output transistor with V(C-E)*I(Load) represented in red.
In the first example with a 4R load, the dissipated power at @1Khz and 50Vrms is completely within the the Soa. When adding 200uH, representing the LS cable in series with with the 4R, the red line already touches the Soa.
However the same situation @10Khz exceeds the Soa, and a breakdown is to be expected.
For all different sorts of load, whether capacitive, inductive or a combination of both, this setup shows exactly what's within or outside the Soa.
Hans
For that purpose you could put this SOA in LTSpice in a current source with a PWL file.
The voltage source in the simple circuit at the left bottom generates in this case 85V-V(Ls), being the VCE of the upper output transistor.
When driving the amp with whatever load, this circuit follows the SOA, in this case the blue line with V(C-E)*I(I1), while looking at the amp you get the real power dissipation in the upper output transistor with V(C-E)*I(Load) represented in red.
In the first example with a 4R load, the dissipated power at @1Khz and 50Vrms is completely within the the Soa. When adding 200uH, representing the LS cable in series with with the 4R, the red line already touches the Soa.
However the same situation @10Khz exceeds the Soa, and a breakdown is to be expected.
For all different sorts of load, whether capacitive, inductive or a combination of both, this setup shows exactly what's within or outside the Soa.
Hans
Attachments
Last edited:
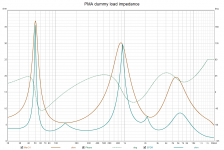
Hi Howard, thank you, you probably mean a kind of REW features that I have not tried yet. I posted the dummy load impedance plots and of course I have Microcap simulations. I will have a look at REW to find out which kind of measurement you mean.
Hi Pavel,
Here is an REW graph showing static impedance and EPDR:
Interesting concept with a pretty long historical background...
Cheers!
Howie
Last edited:
The objective is always to stay within the SOA of the output transistors.
For that purpose you could put this SOA in LTSpice in a current source with a PWL file.
The voltage source in the simple circuit at the left bottom generates in this case 85V-V(Ls), being the VCE of the upper output transistor.
When driving the amp with whatever load, this circuit follows the SOA, in this case the blue line with V(C-E)*I(I1), while looking at the amp you get the real power dissipation in the upper output transistor with V(C-E)*I(Load) represented in red.
In the first example with a 4R load, the dissipated power at @1Khz and 50Vrms is completely within the the Soa. When adding 200uH, representing the LS cable in series with with the 4R, the red line already touches the Soa.
However the same situation @10Khz exceeds the Soa, and a breakdown is to be expected.
For all different sorts of load, whether capacitive, inductive or a combination of both, this setup shows exactly what's within or outside the Soa.
Hans
Thank you Hans, that is a beautiful example!
Cheers!
Howie
Interesting tests PMA.
What is your theory on why a 47nF capacitor doubles THD when put across a 4ohm load? The capacitive reactance is 3.4kohm. My impression is that something must be very wrong for it to have this effect. I've deliberately tested THD with different capacitors at the output to ensure stability into capacitive loads and there should be very little effect if the capacitor is not increasing the load current significantly.
What is your theory on why a 47nF capacitor doubles THD when put across a 4ohm load? The capacitive reactance is 3.4kohm. My impression is that something must be very wrong for it to have this effect. I've deliberately tested THD with different capacitors at the output to ensure stability into capacitive loads and there should be very little effect if the capacitor is not increasing the load current significantly.
Last edited:
I can't find the calculations for EPDR, it seems to be paywalled. I'm not sure why not just plot the max power dissipated in an ideal class B output stage instead. Or that, relative to the nominal impedance.
I haven't verified it yet
Stereophile has started calculating EPDR. | Page 2 | Audio Science Review (ASR) Forum
George
Stereophile has started calculating EPDR. | Page 2 | Audio Science Review (ASR) Forum
George
Many years ago Matti Otala claimed (or at least Harmon attributed to him) peak currents into speakers that were way above anything related to measured impedances (50A as I remember). However I have never seen measurements to support or refute the huge current claims (same for current from the AC line). Its not that hard to measure.
It would be enough to play pink noise at 80 dB to get a number to start with. And really more useful than the more abstract EPDR measurement.
It would be enough to play pink noise at 80 dB to get a number to start with. And really more useful than the more abstract EPDR measurement.
Hi Pavel,
Here is an REW graph showing static impedance and EPDR:
Interesting concept with a pretty long historical background...
Cheers!
Howie
Hi Howard,
thanks for the hint, got it, here is the dummy load impedance with the EPDR curve. It helps me to understand why some amps have issues with it at high frequencies.
Attachments
Last edited:
Interesting tests PMA.
What is your theory on why a 47nF capacitor doubles THD when put across a 4ohm load? The capacitive reactance is 3.4kohm. My impression is that something must be very wrong for it to have this effect. I've deliberately tested THD with different capacitors at the output to ensure stability into capacitive loads and there should be very little effect if the capacitor is not increasing the load current significantly.
I do not know, as the step response is clean without ringing with this load. My assumption is that the ratio and phase of harmonic distortion components have been interacting with the soundcard intrinsic distortion. The reliable distortion figures seem to start with article 1a
http://pmacura.cz/A250W4R_thdampl2_MSYS_4R_1k_xfihdlimit.gif
when I changed the soundcards for another type and also increased measurement BW from 24kHz to 48kHz.
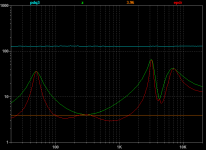
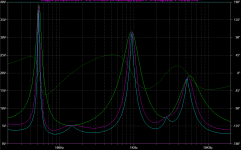
I've been looking into this EPDR stuff and those charts don't look right to me. I don't think the sharp peaks are correct. You can simulate EPDR and the result looks more like the attached image.
I suspect there was an over application of calculus and trigonometry when common sense would have been sufficient. The output stage dissipation is just the total power minus the power dissipated in the load... For a given load impedance, phase angle does not change Iavg or total power, so any reactive power not dissipated in the load must be dissipated in the output transistors instead.
I loaded the paper's equation into LTspice and it does not match the simulated EPDR.
Attachments
Last edited:
However the same situation @10Khz exceeds the Soa, and a breakdown is to be expected.
One could argue that if you are sending out 50V RMS at 10kHz playing music you have bigger problems than SOA? At least in a domestic environment.
I know it's popular to build audio amplifiers that can pump out 100W in the LW band but how much does that matter when you are not driving a pathalogical speaker or running a PA?
Hi Howard,
thanks for the hint, got it, here is the dummy load impedance with the EPDR curve. It helps me to understand why some amps have issues with it at high frequencies.
I've been looking into this EPDR stuff and those charts don't look right to me. I don't think the sharp peaks are correct. You can simulate EPDR and the result looks more like the attached image.
I suspect there was an over application of calculus and trigonometry when common sense would have been sufficient. The output stage dissipation is just the total power minus the power dissipated in the load... For a given load impedance, phase angle does not change Iavg or total power, so any reactive power not dissipated in the load must be dissipated in the output transistors instead.
I loaded the paper's equation into LTspice and it does not match the simulated EPDR.
Anyway something went wrong with one of my soundcards (see phase in the previous measurement).
This is corrected with another card used.
Attachments

Last edited:
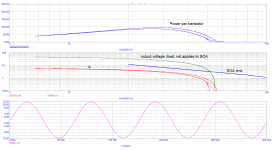
I know, my question is if it was related to my amp. The SOA at 10kHz and 4ohm+L is below, there is still enough space.
There is. And when you add in crest factor and the frequency distribution of music it gets even bigger. Unless you are Ed you won't be pumping 250W into a tweeter for very long until it stops being a tweeter.
My example was a reaction to this EPDR thing, not to PMA's amp.
EPDR is rather vague IMO and looking at the Soa gives a much more valid result.
And yes, 50Vrms at 10Khz is not what you expect while playing music, but large peaks caused by whatever nature might cause this, potentially resulting in a broken amp for this specific amp, a ML23.5, which happens more than once.
Hans
This is corrected with another card used.
My problem with EPDR isn't related to your soundcard, but since you fixed the measurement and there is a schematic on your page, I decided to plug it into the EPDR simulation. Looks like I transferred the equation correctly (cyan curve), but it doesn't match the actual simulated EPDR (magenta curve).
I have the charts size matched so you can flip between them to compare...
EDIT: DIYAudio is shrinking my pictures. What am I supposed to do about that?
Attachments
Unless some conditions make it oscillate I'm quite impressed that anyone has blown up the output stage on a 23.5 other than shorting the outputs.
Many years ago Matti Otala claimed (or at least Harmon attributed to him) peak currents into speakers that were way above anything related to measured impedances (50A as I remember). However I have never seen measurements to support or refute the huge current claims (same for current from the AC line). Its not that hard to measure.
In theory, if you have an amp with 50V rails and you entrain a speaker to a resonance at full output, and then abruptly invert the phase at a peak, you can have your amp pulling 50V and your motional mmf pushing another 50V, and if it is a 2ohm speaker that means 100V/2ohm=50A. But it seems rather contrived to use this as an example of something everyone should be concerned about. And there are a lot of limitations that could come into play before reaching that point. I wonder if you could design a sound file specifically to kill amps...
- Home
- Member Areas
- The Lounge
- The Black Hole......