Not what I wanted but highly interesting regardless. Maybe time to finally get an Omnimic that my buddy has been bugging me to.If you have or can borrow an Omnimic setup, you can get a graph of shaped toneburst envelopes (energy storage) over any range of bands in a waterfall format, calculated from impulse response...that's for measurement, not a simulation. Might not be what you wanted.
Yeah what I had in mind was to at a minimum have something where I could specify a filter resonance frequency and Q, and then input an excitation frequency, and output tone burst response simulations. I feel like I might find interesting things, who knows. For instance the conventional wisdom is that higher Q like 1.3 or something is bad. However if the resonance frequency was 3.2 Hz my guess is it would not matter at audio frequencies.
Now that’s the spirit! My humble advice would be that you work to an understanding of what you see. And hear of course. There are good and reasonably readable books about this. Best read with a good piece of music on the set.And in any case I still want to be able to play around and see what I find.
Bump...because meanwhile, I am still looking for a way to do tone burst simulations.
Even just for second order electrical filters, where i could set the frequency and Q, that would provide some interesting study (like to help answer the question "what happens if I shove 3 woofers into this box instead of 2?)
Even just for second order electrical filters, where i could set the frequency and Q, that would provide some interesting study (like to help answer the question "what happens if I shove 3 woofers into this box instead of 2?)
If you have access to ARTA and a miniDSP, Behringer DCX2496, or other similar DSP units you can simply dial in the LP and HP filter behavior you are interested in and then measure the loop response to ARTA generated tone bursts of desired frequency and duration. Some examples posted here:
Achieve good time domain behaviour to produce single cycle sine
You can also do the calculations with an Excel Macro, if you have access to Excel 2007 or newer. I previously posted some examples for 100Hz single cycle burst, but can post burst response for whatever combination of LP, HP, AP and burst frequency/length you are interested it.
Achieve good time domain behaviour to produce single cycle sine
You may also be interested in seeing wavelet spectrogram showing frequency content vs. time for a tone burst.
Achieve good time domain behaviour to produce single cycle sine
Achieve good time domain behaviour to produce single cycle sine
You can also do the calculations with an Excel Macro, if you have access to Excel 2007 or newer. I previously posted some examples for 100Hz single cycle burst, but can post burst response for whatever combination of LP, HP, AP and burst frequency/length you are interested it.
Achieve good time domain behaviour to produce single cycle sine
You may also be interested in seeing wavelet spectrogram showing frequency content vs. time for a tone burst.
Achieve good time domain behaviour to produce single cycle sine
Last edited:
Oh so cool! Is that something you can send me?You can also do the calculations with an Excel Macro, if you have access to Excel 2007 or newer. I previously posted some examples for 100Hz single cycle burst, but can post burst response for whatever combination of LP, HP, AP and burst frequency/length you are interested it.
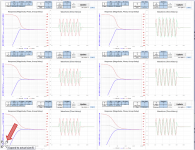
How about, for starters, comparing these?
- Fs=35.35, Q=0.5
- Fs=50, Q=0.707
- Fs=70.7, Q=1
This would be a classic case of the same woofer in ever-smaller box volumes. Frequency...50 and 100?
Send me email address via PM for a copy of the spreadsheet to play with. If others are interested, I can see about cleaning up a copy to post to the forum…add some checks and instructions to make it more user friendly. The spreadsheet can also export the responses as *.wav files if you’d like to see if you can hear the difference, or to import them into other analysis software.
Attached are the plots you requested, along with a *.zip containing the burst responses in *.wav files.
Attached are the plots you requested, along with a *.zip containing the burst responses in *.wav files.
Attachments

Thanks! And I did PM you. The plots are very interesting in that really they do not look terribly different. Some differences, but not as much as I expected. Is it difficult to generate the group delays zoomed in? Or maybe on the same plot? It looks like some are negative but I think it is the scale of the thing.the plots you requested
Anyway on takeaway is that stuffing 2 woofers instead 1 into a box could be OK-some worsening of time response (which is not even obviously evident) could be an acceptable tradeoff for more cone area and voice coil with less excursion.
No, group delay isn't negative. Not sure if you were aware there is an "expand" button in the lower left corner of images in this forum if they were shrunk to fit available browser window size. In any case, this is just an Excel spreadsheet, so you can generate any plot or scaling of plot you want with the data.
BTW, I have not received your PM yet.
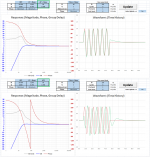
You may also be interested in the effect of the LP filter and/or crossover with mains. If crossed properly, the magnitude of the response is flat, but there will be phase rotation thru the crossover range which has a big effect on waveform reproduction. As an example, suppose you had a theoretically perfect loudspeaker flat to 20Hz. Reproduction of a 150Hz burst would be nearly perfect. But, in reality most subwoofers flat to 20Hz are crossed ~80Hz to mains. Look at the resulting waveform distortion for a 150Hz burst.
BTW, I have not received your PM yet.
You may also be interested in the effect of the LP filter and/or crossover with mains. If crossed properly, the magnitude of the response is flat, but there will be phase rotation thru the crossover range which has a big effect on waveform reproduction. As an example, suppose you had a theoretically perfect loudspeaker flat to 20Hz. Reproduction of a 150Hz burst would be nearly perfect. But, in reality most subwoofers flat to 20Hz are crossed ~80Hz to mains. Look at the resulting waveform distortion for a 150Hz burst.
Attachments
Keele Tone-Burst Test | SynAudCon
I attended a pro speaker design seminar in 1995. I meet many of the gurus including Don Keele, Pat Brown and 100's of others. We discussed this idea and Don gave a talk on it. I suggested they make a test CD; and they did just that!
I never actually bothered for myself but this might answer some questions about signal burst testing...FWIW...
- Home
- Loudspeakers
- Multi-Way
- Woofer tone burst simulation?