I al looking to understand the physics of why the distortion curve for drivers, any driver so ignore this example, has the same basic shape of the sharp knee. The only exceptions is a couple of tweeters I have measured. It does not seem related to x-max, impedance, loading or anything I can think of. The only papers I find on driver distortion focus on the shape of the field in the gap, underhung coils, suspensions etc.
Attachments
Try to find "How to graph distortion measurements" by Steve F. Temme (Bruel&Kjaer, Naerum, Denmark) presented at the 94th AES Convention 1993, March 16-19, Berlin
Last edited:
$33 for non-members and my anthology four volumes left off in 91. I don't think AES did a 5th anthology.
How to graph is a different subject. Yes, it is a bit difficult as if you look at the typical graphs that HOLM, SE, or ARTA can provide, extracting the response from the harmonics is quite a calculation intensive project. Looking at doing it with Excel. Looking at plots from ZAPH are very hard to interpret without normalizing the response first.
I am wondering about the fundamental physics that cause this overall shape where the distortion skyrockets way higher in frequency that the natural roll-off, rise in impedance, Fs, or X-max would appear to be an issue. We see th same shape at 80 dB as we do at 90 or 100.
Google hits are regional What fun. eselab.si does come up, but nothing about any AES papers, just their phono stage. First 10 pages does not find anything other than the AES sits. Listeninc.com claimed to have it but registering did not gain access. Dogpile had more hits on the subject, but not what I am looking for. If the rise was the inverse of the LF roll-off, that woudl make sense, but it seems to be over an octave higher or more. And it does not make sense that some drivers (a couple of tweeters I found) do not have this.
Got it! With the author, I only get the AES site. If only the domain, I get the eselab site, but no access past that. I did review some of th comments by the late Sid Linkwitz, some comments by CSS etc. and several on what may or may not be audible, but nothing on the physics of the motor.
Off to read.
Off to read.
There is another source of information you may find useful. Copy paste "application note audio distortion measurements by steve temme" and landing at bksv com, you should be able to view 20 pages in pdf.
One definition of Xmax is the one-way peak excursion which produces 10% THD of the current waveform when driven at FS, the free air resonant frequency.I am wondering about the fundamental physics that cause this overall shape where the distortion skyrockets way higher in frequency that the natural roll-off, rise in impedance, Fs, or X-max would appear to be an issue. We see th same shape at 80 dB as we do at 90 or 100.
Simply put, Xmax is the range of motion the cone can move and still be controlled linearly by the magnet structure. The further the voice coil is pushed out of the magnetic gap, the more harmonic distortion created.
This paper gets into the why and what of it:
https://www.klippel.de/fileadmin/kl...t_of_Voice_coil_peak_displacement_XMAX_02.pdf
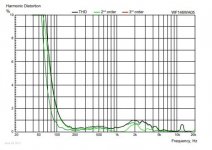
A sealed loudspeaker requires four times the excursion to produce the same output level as frequency is halved. In your example posted in the OP, THD of the driver is 10% at around 60 Hz. If that speaker has reached 6mm Xmax at 60Hz, at 120Hz it's excursion would only be 1.5mm, at 240 Hz only .375mm.
The harmonic distortion curve at the low end closely follows the exponential increase in excursion.
Art
OK. I understand all of what is being said. If the curves looked like Fig.7, then it would just be reflective of the inverse of the roll-off while maintaining the same sound pressure. Except, the curves I am seeing are higher frequency and much steeper.
Not confusing x-max with maximum excursion As published, it is sometimes confusing as some list one way, some list X-max as p-p. I do not know where your 10% came from as I have not seen that in a specification. It would be beneficial if it was adding some consistency.
I still come to the conclusion the knee is at a higher frequency and steeper than the natural roll off and excursion suggest. What the above descriptions do not take into account, is some drivers do have the lower knee and more of the inverse slope as one might expect.
Again, these curves are for relatively very low power. Less than 1 Watt. So even in a sealed system, that would suggest 4W for a driver designed for 60W continuous.
The above example was just one I grabbed to show the shape instead of scribbling and scanning. The above example, actually does not exceed x-max until 4W @ roughly 25 Hz. @ 150 Hz, it is only about .75mm. Pe is 55W. If it was just a displacement question, the curves would diverge as they approach the knee, but they don't. They seem to offset.
If put into the perspective that Linkwitz showed on the importance of low base distortion, it is not a pretty picture.
There is another factor here somewhere.
AES2-1984 (r2003) subsection 4.3.2 defines Xmax.Not confusing x-max with maximum excursion As published, it is sometimes confusing as some list one way, some list X-max as p-p. I do not know where your 10% came from as I have not seen that in a specification.
Xlim (or Xmech) is sometimes reported as peak to peak excursion, though often goes unlisted.
Xmax is one-way linear excursion measured in free air at Fs.
Xmax is also derived by measurement of voice coil length vs magnetic gap height. The harmonic distortion by that derivation won't be known, though empirical THD measurement of well made drivers results in similar distortion vs. the AES2-1984 (r2003) definition.
A driver in a small sealed cabinet would require a higher voltage to reach Xmax than it would measured in free air. A driver can easily exceed Xmax at a fraction of it's power limit (Pe), or also exceed it's Pe without exceeding Xmax.
Attachments

The frequency response is dictated by two mechanisms. Firstly the inductance of the voicecoil which causes a 1st order rolloff with the corner frequency determined by the resistance of the voicecoil (RL lowpass filter). Secondly you have breakup caused by the cone and other mechanical parts, which 'shapes' the response dictated by the voicecoil parameters. If the breakup occurs above the RL corner frequency, this can serve to boost the freq response over a range of frequencies, so the RL rolloff and breakup may oppose each other to achieve a more extended (but usually rough) response before finally rolling off.
Non-linear distortion is caused by many things see: Zaph|Audio - The importance of non-linear distortion
The important thing to note is that cone breakup also boosts non-linear distortion products just as it does the fundamental. If you have a cone that breaks up at say 5kHz, then when the driver plays 1kHz tone and generates a 5th order harmonic distortion product at 5kHz, the distortion product lands on the breakup of the cone and itself gets boosted. The result is a spike in 5th order distortion at 1kHz. From this point of view, I and many others prefer drivers which have breakup at higher frequencies (e.g. metal coned woofers), even if the breakup is more severe as it means that the distortion remains lower up to a higher frequency.
If you look at harmonic distortion which show individual products (2nd, 3rd, 4th order etc) you will find that the shape of the distortion products follows the characteristic curve of the cone breakup. Even without distortion data you can predict where elevated harmonic distortion will occur, lower in frequency, by dividing the breakup node frequencies observed in the frequency response.
Last edited:
Lots of valid comments, just none quite address the question. That is why the increase in distortion rises as sharply as it does, at higher frequency than the LF roll-off, way way above Fs, and at a small fraction of x-max, but only on some drivers, and not on others.
The shape and slope of the knee does not change from very low drive to high drive and. When looking at the model for excursion, it behaves as expected offsetting the entire curve, but not changing the shape. As drive increases, the offset gets larger. Quite expected.
TMM, Yes, all valid but you are thinking the high end of the response, I am talking about the low end. At this end, the cone should be acting as a piston. At the low drive levels, no oil-canning, bell mode, teeter-totter or other cone distortion mechanisms. No breakup of the dust cap which can be way worse than the cone. My only disagreement is how hard it is to suppress breakup in some drivers leading to very steep and low crossovers. I am waffling between Wavecor and SB drivers, and which material for the cone as they make the same basic driver with different cones.
Welter, your definition of X-max is what I was taught, not the AES spec you reference. Thanks. Guess I am not the only one who has not read it as some manufactures list one way, and others peak to peak, and others do not say. X-Lim is usually listed as the mechanical limit and is larger than x-max. As in when the former hits the pole piece.
Before COVID, I was going to go down and see if the UNC or Duke libraries have access to AES papers. As Coach Otto Graham said, "Wait 'till next year".
then why show it at all? 😕I al looking to understand the physics of why the distortion curve for drivers, any driver so ignore this example
, has the same basic shape of the sharp knee. The only exceptions is a couple of tweeters I have measured. It does not seem related to x-max, impedance, loading or anything I can think of.
But it is, even if not specifically mentioned.
It clearly shows voice coil reaching "unmagnetized space" and losing oomph, big time.
And for good reason.The only papers I find on driver distortion focus on the shape of the field in the gap, underhung coils, suspensions etc.
"Shape" shows where and by how much flux density dies.
"Underhung" is one way to guarantee (to a point) voice coil will stay inside a very linear magnetic field.
And so on.
Those are the distortion creating mechanisms, then how you display them is fine, of course, but something else.
Why does the curve rise so steeply?
Compare it to a power amplifier: while in the linear zone you may very well have 0.01% distortion or better; but once you start clipping .... you quickly reach and surpass 10%, orders of magnitude higher and obviously a steep rise.
I guess the point about very low power and displacement keeps getting lost and that the shape does not change with power, just the offset.
I have not followed closely but are you expecting distortion SPL to scale with deflection which won't be the case?
Not scale, but be related. There seems to be another factor causing it to rise at a higher rate on some and not on others, and to rise sharply at a higher frequency than displacement alone would suggest.
This shows some distortion plots (scroll down) for a decent 8" driver in a sealed enclosure (no output from a port complicating things). SPL against frequency where THD becomes an issue which is possibly the most relevant THD plot for a speaker spec but is rarely shown. THD against frequency at a couple of SPLs which is useful for engineering issues. In combination with the SPL vs frequency plot it seems to show a consistent picture with higher distortion being generated by deflections beyond a reasonably linear "xmax". Is this aligned with what has prompted your post?
Last edited:
It is the difference in characteristic curve, some closer to mirror the roll-off as one would expect as you increase power and therefor displacement for a constant SPL. But some rise far steeper at a higher frequency.
As there does not seem to be any standards for measurement, either power or baffle, that may account for some, but tweeters, kind of by definition, will all be a tuned chamber and I see the difference in them.
What I take away from my measurements is that even though a small mid-bass may have an x-max of 5mm and can easily meet the SPL and FR requirement @ 80 Hz in cabinet, one should design so that the useful displacement does not exceed about 1mm. So for my current project, I am using two of the 5 inchers to reach my targets. Going to a 7 does not work as it can't reach my tweeter cleanly, though it would meet the 80 Hz mark.
Curious, I keep getting led back to the 10-4-1 inch, 300, 3000 Hz "traditional" monkey coffin design as optimal. Physical limitations preclude it for this project. It also starts to make me re-think traditional sub crossovers and cabinets.
- Home
- Loudspeakers
- Multi-Way
- Driver distortion curve shape