Below is phase angle measured on a w8-1772.
Notice the highs phase angle shoots pretty negative......
Tang Band W8-1772 Impressions.
Post 620
I've seen somewhat jagged step resposes also (voxativ)
Voxativ Ampeggio loudspeaker Measurements | Stereophile.com
So, do the highs and lows leave at the same time ?
Notice the highs phase angle shoots pretty negative......
Tang Band W8-1772 Impressions.
Post 620
I've seen somewhat jagged step resposes also (voxativ)
Voxativ Ampeggio loudspeaker Measurements | Stereophile.com
So, do the highs and lows leave at the same time ?
Attachments
Last edited:
Any driver with low end rolloff will have lower frequencies' phase lagging higher.
Since phase is relative, i would want to see the phase graph for that driver, where phase is set at 0 degrees at the upper end of response, as high as you get before response gets too wobbly to use.
And then look at its slope / overall shape.
The graph shown tags phase at zero at around 1-3kHz....which can't help but make the high end look like it rolls negative.
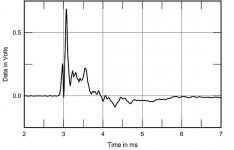
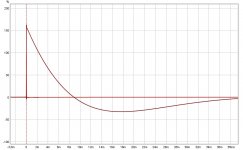
Here's a semi ideal virtually created impulse generated by RePhase @96000
band pass roll off second order at 20 Hz and 22 KHz:

Similar to a full range driver if there ever was one that could do such a wide bandwith...
And just to get it out of the way, here's what the STEP looks like:

band pass roll off second order at 20 Hz and 22 KHz:
Similar to a full range driver if there ever was one that could do such a wide bandwith...
And just to get it out of the way, here's what the STEP looks like:
Attachments
Last edited:
The FE108e∑ (no whizzer, probably less inductance also), in stereophile, its phase actually shoot up.
Then again, so does the freq response.
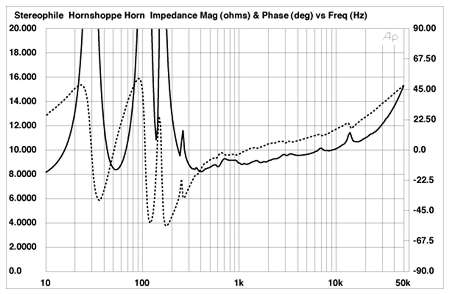
Horn Shoppe Horn loudspeaker Measurements | Stereophile.com
Then again, so does the freq response.
Horn Shoppe Horn loudspeaker Measurements | Stereophile.com
I don't see a phase trace, as the electrical phase is an entirely different thing, that one doesn't count. Not a real good performing driver though, a bit rough top end. Some may like it though.
Hi Norman, the Horn Shoppe graph looks to me to be another case where phase was pegged to be zero deg at around 1kHz.
Like said prior post, phase is relative so deciding where you want to call zero is arbitrary.
For ages, conventional wisdom has been to call phase zero where its curve is flattest, which also corresponds to where frequency response is flattest, which also is almost invariably in the middle of the driver's range.
In the case of a full range driver, setting 1kHz as the zero phase point, where 1kHz is close to the center of the full range, makes sense.
Establishing that 1kHz zero point is a function of what timing reference the measurement program used...like what loopback time in REW, etc.
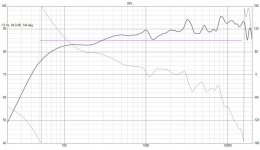
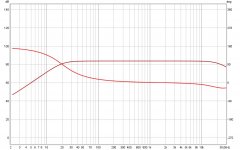
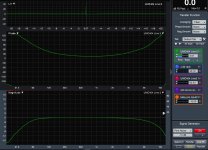
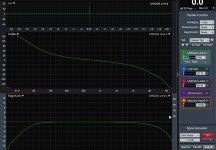
To show that impact, the following two graphs are the exact same electrical frequency response, but measured with slightly different reference times.
The electrical signal is full range pink, with a 1st order BW hpf at 50Hz and a first order BW lpf at 10kHz.
Note the Mag response is the same in both, but the high end phase response curves up on one and down on the other.
This is due to only a 0.05ms difference in the measurement timing reference.
You can see the timing ref in the green box on the right side labeled UMC404 Line 2.
3.07ms for the upward phase, 3.02 for the downward.
(The processor generating the electrical signal has a latency of about 3.05ms, that's why either side of that value shows up or down at the highend)
Bottom line imo, is don't take VHF phase seriously when phase graphs are at zero in the middle of the frequency range. A little bit of time one way or another changes everything up high.
Hope that helps, and/or apologize if info you already know..
Like said prior post, phase is relative so deciding where you want to call zero is arbitrary.
For ages, conventional wisdom has been to call phase zero where its curve is flattest, which also corresponds to where frequency response is flattest, which also is almost invariably in the middle of the driver's range.
In the case of a full range driver, setting 1kHz as the zero phase point, where 1kHz is close to the center of the full range, makes sense.
Establishing that 1kHz zero point is a function of what timing reference the measurement program used...like what loopback time in REW, etc.
To show that impact, the following two graphs are the exact same electrical frequency response, but measured with slightly different reference times.
The electrical signal is full range pink, with a 1st order BW hpf at 50Hz and a first order BW lpf at 10kHz.
Note the Mag response is the same in both, but the high end phase response curves up on one and down on the other.
This is due to only a 0.05ms difference in the measurement timing reference.
You can see the timing ref in the green box on the right side labeled UMC404 Line 2.
3.07ms for the upward phase, 3.02 for the downward.
(The processor generating the electrical signal has a latency of about 3.05ms, that's why either side of that value shows up or down at the highend)
Bottom line imo, is don't take VHF phase seriously when phase graphs are at zero in the middle of the frequency range. A little bit of time one way or another changes everything up high.
Hope that helps, and/or apologize if info you already know..
Attachments
So where's the phase trace of the Horn Shoppe, I only see magnitude. A phase trace belonging to an impedance measurement (electrical phase) is not the same as a phase trace of the acoustical output (acoustical phase).
Hi Wesayso,
It doesn't matter to the point i was trying to make, whether the phase is from an electrical or acoustical measurement.
Point being, phase is relative, and it's hard to make much out of the high end phase response on any phase graph, when phase is pegged at zero much below the highest frequency response.
Related aside i think you might like if you haven't heard it...
I read Richard Heyser said, that below Nyquist, the limit of response, there is a low pass filter already inherently in place.
And that phase has already rotating some at the very top limit of frequency response...
that the phase = zero true reference point is above Nyquist !! pretty cool deep thinking man i thought !
Well, 0,05 ms is one cycle duration at 20 KHz, so the phase plot is going to look different if you're one cycle off 🙂.
At middle frequencies 0.05 ms hardly makes a difference so that's why they both end up around zero at similar spots...
At middle frequencies 0.05 ms hardly makes a difference so that's why they both end up around zero at similar spots...
Last edited:
FE108e∑...Horn Shoppe Horn loudspeaker Measurements | Stereophile.com
dave
Well, 0,05 ms is one cycle duration at 20 KHz, so the phase plot is going to look different if you're one cycle off 🙂.
At middle frequencies 0.05 ms hardly makes a difference so that's why they both end up around zero at similar spots...
Of course !
That's exactly why i think you have to ignore phase plots up high, when they are not pegged to zero up high.
Peg the VHF to zero, and then let the rest of the curve show itself.....
That's the truest picture of relative phase across the spectrum imo.
You can clearly see the whizzer on those.
dae
What's interesting, is how it appears to lag the main cone...assuming the whizzer is supplying all the VHF energy, and a fair share of the upper HF...which would make the tall peak the whizzer.
The whizzer is the 1st peak, the main cone just behind it. Just like a tweeter in a typical multi-way system.
dave
dave
...impedance plot...
The factory plot has blips just above 1.5K and another about 3k.
Rutcho’s measures on the 1772 (and the 1808) suggest 2.1 kHz.
dave
interesting.
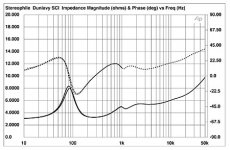
like dunlavy sc1 in stereophile ?
Dunlavy Audio Labs SC-I loudspeaker Measurements | Stereophile.com
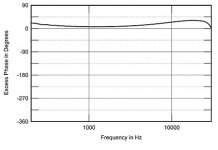
"These excellent pulse and step shapes imply that the speaker's phase response is similarly excellent. Fig.9 shows the SC-I's excess phase plotted against frequency. "Excess" phase is the speaker's actual phase response with the phase deviations associated with the speaker's departure from flat response subtracted; in the case of the Dunlavy, it varies by no more than ±5° from 400Hz to 4kHz. The slight positive phase angle, increasing with frequency in the high treble, implies that I didn't have the microphone exactly on the tweeter axis, but probably to one side. At 15° at 10kHz, however, this is negligible, implying that the tweeter's acoustic center was positioned just 1.4mm behind that of the woofers. (The wavelength of sound at 10kHz is 35mm or so.) "
like dunlavy sc1 in stereophile ?
Dunlavy Audio Labs SC-I loudspeaker Measurements | Stereophile.com
"These excellent pulse and step shapes imply that the speaker's phase response is similarly excellent. Fig.9 shows the SC-I's excess phase plotted against frequency. "Excess" phase is the speaker's actual phase response with the phase deviations associated with the speaker's departure from flat response subtracted; in the case of the Dunlavy, it varies by no more than ±5° from 400Hz to 4kHz. The slight positive phase angle, increasing with frequency in the high treble, implies that I didn't have the microphone exactly on the tweeter axis, but probably to one side. At 15° at 10kHz, however, this is negligible, implying that the tweeter's acoustic center was positioned just 1.4mm behind that of the woofers. (The wavelength of sound at 10kHz is 35mm or so.) "
Attachments
Norman,
Being a multiway the listening area over which the phase corrctness is effective is very small.
dave
Being a multiway the listening area over which the phase corrctness is effective is very small.
dave
That first plot is again, electrical phase and has no tight relation to the frequency curve.
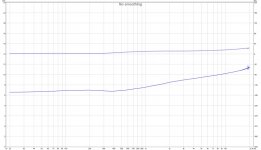
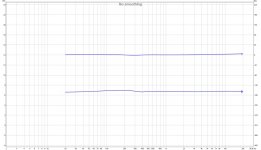
Here's some impedance phase plots of my array,

With a partial conjugation network
and:

with full conjugation network
The upper lines in these plots are the electrical phase
It bears no relation to it's final timing as measured in a frequency curve.
p.s. the blip at 19 KHz is my old laptop's soundcard acting up during impedance measurements.
What are you looking for in these impedance/phase plots? 😕
Here's some impedance phase plots of my array,
With a partial conjugation network
and:
with full conjugation network
The upper lines in these plots are the electrical phase
It bears no relation to it's final timing as measured in a frequency curve.
p.s. the blip at 19 KHz is my old laptop's soundcard acting up during impedance measurements.
What are you looking for in these impedance/phase plots? 😕
Attachments
Last edited:
- Home
- Loudspeakers
- Full Range
- Phase of a fullrange driver, highs lead lows ?