I read Wolfgang Klippel on the causes of even and odd order harmonic distortion. Didn’t do a thorough job maybe, would be glad to receive an explanation otherwise. And it only applies to the motor of the speaker, that should be noted.
As for higher orders and the energy transfer, I am not on the positivist’s side of scientists. I believe in energy balance though. It’s clear a higher frequency distortion product requires more energy to reach the same level as the lower one, given the moving mass stays the same.
As for higher orders and the energy transfer, I am not on the positivist’s side of scientists. I believe in energy balance though. It’s clear a higher frequency distortion product requires more energy to reach the same level as the lower one, given the moving mass stays the same.
The motor can have even and odd components, although odd will be the most common since the VC has a limited travel in both directions, i.e. it is symmetric. Some motors can actually have higher 2nd than 3rd however. Inductance tends to have more even orders.
The harmonics are indeed lower in energy, they are way lower than the fundamental, but they can be amplified by resonances. But our perception of them can still be high even at those lower levels.
The harmonics are indeed lower in energy, they are way lower than the fundamental, but they can be amplified by resonances. But our perception of them can still be high even at those lower levels.
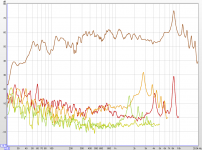
No rocket science contained in this post 🙂 First image is a raw Seas L15 aluminium cone driver with primary breakup ~ 8100Hz.
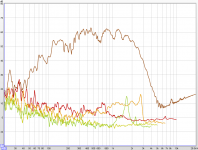
2nd image is with a steep order XO @ 2,300Hz with a notch filter on the breakup. You can see the 3rd order is somewhat attenuated, but there is little / no change on 5th order HD since the XO cuts above the 5th order distortion
2nd image is with a steep order XO @ 2,300Hz with a notch filter on the breakup. You can see the 3rd order is somewhat attenuated, but there is little / no change on 5th order HD since the XO cuts above the 5th order distortion
Attachments

Thank you. A notch, a steep slope, and still no attenuation of the 5th. Wow, I learned something new today🙂
Last edited:
If the cone is bending variably with frequency, will a single pressure measurement be proportional to the amount the motor moves and how does this relate?
If the cone is bending variably with frequency, will a single pressure measurement be proportional to the amount the motor moves and how does this relate?
Interesting... are you asking whether the actual HD induced will vary with varying voltage input and a fixed voltage sine wave sweep? Or is this what an IMD measurement would assess?
I suppose the distortion could be any non-linearity. I would hope cone bending is less likely with a more rigid material (aluminium in this case with a steep / deep cone profile)
Thanks for the data!No rocket science contained in this post 🙂 First image is a raw Seas L15 aluminium cone driver with primary breakup ~ 8100Hz.
2nd image is with a steep order XO @ 2,300Hz with a notch filter on the breakup. You can see the 3rd order is somewhat attenuated, but there is little / no change on 5th order HD since the XO cuts above the 5th order distortion
Out of curiosity, without the XO, how much would the notch have cut down from the response peak and how broad is the notch (dB/Q)?
@ Dave, I don't know the answer to some of your suggestions, but what I'm saying is that with the cone bending, the pressure measured on axis may no longer be proportional to the movement of the motor as it otherwise might.
For my own understanding...
Peaks in the frequency response curve can indicate resonances which suggest the severity of any ringing. This is more easily seen in a waterfall graph.
A lower crossover point and/or a notch filter can change the frequency response, and to make the ringing seem to go away. It will help prevent the resonance from being excited.
But the ringing still exists in the cone (or other radiating surface) and can still be excited by other (lower) frequencies or transients, as a distortion component.
Does this sound correct?
So we do not disagree completely on different causes of even and uneven order distortion? Part of the distortion in motors actually rises from non-symmetry. Just as it will in the suspension, the cone itself and the surround.The motor can have even and odd components, although odd will be the most common since the VC has a limited travel in both directions, i.e. it is symmetric. Some motors can actually have higher 2nd than 3rd however. Inductance tends to have more even orders.
I addressed the levels between harmonics, not the level difference with the fundamental. But it's no more than my hypothesis that this stems from the energy transition from the fundamental movement to the harmonic movements of (parts of) the cone or surround. The same applies to the energy stored in resonances. We all know what to do with hypotheses. Dave's measurements sure do rise a question, likely the probable bell mode breakup has some directional 'bonus'. @Dave, did you do polars or off-axis measurements?The harmonics are indeed lower in energy, they are way lower than the fundamental, but they can be amplified by resonances.
True, but how high? Does one actually hear H5 at -45dB in music signal?But our perception of them can still be high even at those lower levels.
Last edited:
Thanks for the data!
Out of curiosity, without the XO, how much would the notch have cut down from the response peak and how broad is the notch (dB/Q)?
Hi,
The notch was series and was bottomless (no resistor) - so very narrow / high Q. I think I might have the transfer function somewhere. If I can find it, I'll post it. I did not do a "notch only" measurement to see how much effect a notch has alone. This would be interesting. Sadly - the speaker is complete and everything soldered up, so I don't feel like a deconstruction to find out.
All measurements were done in box with "lazy REW" use - i.e. no fancy impulse gating or anything.
@Dave, did you do polars or off-axis measurements?
Sadly no - a first timer 3-way beginner's error 🙂 These would be valuable.
I will use these again as my reference when measuring my next pair and measure some horizontal off-axis responses.. but for now, nothing sorry.
Cobianchi and others have performed polar measurements on H2 and H3 of domes, cones and horns. The lobing indeed is happening.
Nonlinear Distortion and Perception at Low Frequencies | AudioholicsTrue, but how high? Does one actually hear H5 at -45dB in music signal?
With special reference to https://www.audioholics.com/loudspe...at-bass/Figure850HzMaskingThreshold.jpg/image
As you can see, there is very little masking near the sensitive region in midrange (low treble?). Unfortunately, we cannot draw a full conclusion from this because apparently the testing was only done using 50 Hz tones (one frequency, and not music). However, I would be very interested to see data showing increased masking from music vs tones, which is quite plausible.
What does that means, "to shift the curves..."?Since the cause of even order harmonic distortion in electrodynamic drivers is different from that of the uneven orders, you cannot compare the patterns. I made the difference in my post. Also, be sure to shift the curves to the corresponding frequencies before comparing...
In most graphs showing HD you see the distortion as a fraction of the fundamental, but at the fundamental frequency. When comparing absolute levels of harmonic distortion products, in those graphs you have to shift the H2 curve to the double frequency, the H3 to the triple and so on. Perfectly logical if you think it through. But did you do that when you compared the curves?
This phenomenon is actually quite well known and a lot of small speakers rely on this, pretending to produce real bass. I personally believe the discussion of fast vs slow bass comes forth from comparing speakers with rather high HD in low frequency ranges. So yes, we notice and a lot of us think it is preferable 🙄As you can see, there is very little masking near the sensitive region in midrange (low treble?). Unfortunately, we cannot draw a full conclusion from this because apparently the testing was only done using 50 Hz tones (one frequency, and not music). However, I would be very interested to see data showing increased masking from music vs tones, which is quite plausible.
However I still think a total HD component of 1% with rather normal distribution hardly causes any problems in all but maybe the most critical listening conditions. I mean I can distinguish 1% THD on a sine wave of 400Hz 100% of the time but give me piano music and I have a hard time. And think of this: people crave tube amps and vinyl, ever figured what distortion that brought and brings us?
Primarily H2 and H3, but again, those two invariably dominate THD values which does not give a good idea of the audible impact of higher orders.And think of this: people crave tube amps and vinyl, ever figured what distortion that brought and brings us?
If I'm understanding you correctly, you mean that the relative distortion products need to be normalized to the sensitivity of the frequency that they get produced at? So, if the sensitivity of a driver is down -6 dB at 3 kHz relative to that at the 1 kHz test frequency, and the H3 from the 1 kHz tone is -60 dB, the "true" H3 is actually -54 dB?In most graphs showing HD you see the distortion as a fraction of the fundamental, but at the fundamental frequency. When comparing absolute levels of harmonic distortion products, in those graphs you have to shift the H2 curve to the double frequency, the H3 to the triple and so on. Perfectly logical if you think it through. But did you do that when you compared the curves?
Either way, I don't see the value in shifting the curves since this "shifting" is not in any implementation in a loudspeaker that I'm aware of and seems to be purely academic. Can you link to another resource that shows a practical example of this?
- Home
- Loudspeakers
- Multi-Way
- cone breakup