With what real world microphone and recording equipment to capture these rise-times?
Beside the usual suspects from Brüel & Kjaer or Grass, Sennheiser developed a range of microphones a couple of years ago ( MKH 800/8000 series) with an extended frequency range up to 50 Khz.
So KSTR is that an example of why the Redbook version on tidal often sounds better than the ‘master’ version.......which is likely just upsampled?
If so I don’t understand why, other than marketing.......it’s quite obviously inferior.
If so I don’t understand why, other than marketing.......it’s quite obviously inferior.
I do not understand the dug in refusal to deal with this. It is most important points.
THx-RNMarsh
Just a friendly question to escape the current discussion.
Have you ever compared Quad ESL speakers to your current speakers while playing cymbals or other instruments with hard attacks producing harmonics beyond 20Khz.
I just mention these ESL speakers because of their exceptionally low distortion and their fabulous step response.
Because of you hearing the difference in 192 versus 44.1 recordings of such “fast” material, IM speaker distortion in the ultrasonic could very well be the cause of change of timbre in the sub 18Khz range.
Ever thought about that ?
The file for instance that Elektroj has supplied, contains some almost deafening drum passages om my ESL’s, not in volume but in fast attack, despite the fact that it was played at 44.1/16.
And don’t say at forehand that your speakers are beyond suspicion, you may be surprised how fast an electrostat responds to an attack.
Hans
Addendum:
- LTspice's output file sampler just samples the output trace at the proper time points, and does linear interpolation between trace sample points which are at arbitrary intervals, though spec'd not to be greater than 50ns apart (in the .tran card). No filtering is applied --> aliasing.
- The FIR filter output seems somehwat crippled by an apparent zero-order hold @ 1Mhz (1us step widths visible when zoomed in).
Not the best conditions for investigations of asserted quality and repeatability would be the overall conclusion.
Just a friendly question to escape the current discussion.
<snip>
Hans
Hans, RNMarsh in fact did have a pair of Quad ESLs (still has it afair) in use, before getting the M2s.
EDIT: Zoomed in on the relevant parts of the original 5x20 and the filter output, both at 384k. The leftmost and, sorry, the second rightmost zero-crossings are the symmetry points and other halves of the responses are cropped after that, so have to extend that mentally. Done for higher visible resolution.Excellent work, thank you.
What is the first plot?
I'd say no. It is just a special investigation on the question whether brickwalling to 20kHz really affects the envelope and spectrum of that specific "5kHz*20kHz" transient test signal (a "blip" as we say) proposed by JN, as this is what happens during recording and (re-)mastering. The data originally presented by Hans had some processing shortcomings which raised confusion but the issue is settled.So KSTR is that an example of why the Redbook version on tidal often sounds better than the ‘master’ version.......which is likely just upsampled?
Thanks KSTR,
Yah I’ve been following, it just looked liked what might happen during upsampling of a Redbook recording.
Yah I’ve been following, it just looked liked what might happen during upsampling of a Redbook recording.
Why is the filter output carrier a lower frequency than the Vout freq?EDIT: Zoomed in on the relevant parts of the original 5x20 and the filter output, both at 384k. The leftmost and, sorry, the second rightmost zero-crossings are the symmetry points and other halves of the responses are cropped after that, so have to extend that mentally. Done for higher visible resolution.
Jn
Not the best conditions for investigations of asserted quality and repeatability would be the overall conclusion.
I've said this before, don't try to use LTSPICE as a general purpose signal processing tool.
Jn,
After clearing my head some with a night's sleep, the trig identity you posted is not the math for amplitude modulation nor for intermodulation (two different things). Sorry for any confusion caused by my mis-remembering some details in the heat of the back-and-forth fray that can occur here.
Back in the day when I studied this stuff the way amplitude modulation was accomplished (again, from memory) was to use intermodulation then filter out the one unwanted original frequency (the remaining unwanted baseband audio signal in the case of radio amplitude modulation). Very briefly, if done appropriately that left the carrier and the two sidebands (to a sufficient approximation).
A math explanation for amplitude modulation can be found at: Amplitude modulation - Wikipedia
Math description for intermodulation may be found at: Intermodulation - Wikipedia
Obviously the two explanations are different, and neither one is simple summation.
Last edited:
The intermodulation link is inappropriate to the discussion, it refers to non linearity, not what is being discussed here.Jn,
After clearing my head some with a night's sleep, the trig identity you posted is not the math for amplitude modulation nor for intermodulation (two different things). Sorry for any confusion caused by my mis-remembering some details in the heat of the back-and-forth fray that can occur here.
Back in the day when I studied this stuff the way amplitude modulation was accomplished (again, from memory) was to use intermodulation then filter out the one unwanted original frequency (the remaining unwanted baseband audio signal in the case of radio amplitude modulation). Very briefly, if done appropriately that left the carrier and the two sidebands (to a sufficient approximation).
A math explanation for amplitude modulation can be found at: Amplitude modulation - Wikipedia
Math description for intermodulation may be found at: Intermodulation - Wikipedia
Obviously the two explanations are different, and neither one is simple summation.
Instead, go to the link provided by scottjoplin. Look at the top right picture where they show a beat pattern, and very specifically, the math of what is being depicted. I think I'm linking it correctly, bear with me...
https://upload.wikimedia.org/wikipedia/commons/2/2e/Beating_Frequency.svg
it worked...thank goodness. but it just provides the picture, just google beat frequency, the main page will show with that in the upper right.
Note the form of the equation.
Heat of the back and forth fray? Huh?, it's a discussion about math and techy things, we're not insulting each other.😕
Well, some miniature poodle like posters do that.
jn
Last edited:
The intermodulation link is inappropriate to the discussion, it refers to non linearity, not what is being discussed here.
Except it has already been stated that sampling is a nonlinear operation.
Heat of the back and forth fray? Huh?, it's a discussion about math and techy things, we're not insulting each other.
I was speaking of many people rapidly talking past each other in a way that is much less likely to happen between two people in friendly conversation working on a problem together.
Well, some miniature poodle like posters do that.
Sounds like it could be intended as insult.
It isn't, and any filter cannot change that. You are still mistaking the peak magnitude point of the filtered response as the point where the carrier freq is situated, which is only true when no additional EQ is present, obviously. With EQ, the peak point in the spectrum does shift but the carrier and the sideband frequencies are not changed. In a single cycle of raised cosine window the components have widespread leakage, in the periodic equivalent we see distinct lines at 20k carrier and 15/25kHz lower sidebands and that picture doesn't change when additional EQ is applied to this.Why is the filter output carrier a lower frequency than the Vout freq?
Jn
It doesn't require sampling.Except it has already been stated that sampling is a nonlinear operation.
The identity between a beat frequency of two waves and amplitude modulation has been clearly shown. First, by the simple trig identity, then on a site which is written specifically for beat frequency content.
Again, there is no waveform distinction between the sum of two sines and the product of two sines (given specific parameters). Any filter is incapable of distinguishing which method was used to produce the sine modulated output.
jn
Just a friendly question to escape the current discussion.
Have you ever compared Quad ESL speakers to your current speakers while playing cymbals or other instruments with hard attacks producing harmonics beyond 20Khz.
I just mention these ESL speakers because of their exceptionally low distortion and their fabulous step response.
Because of you hearing the difference in 192 versus 44.1 recordings of such “fast” material, IM speaker distortion in the ultrasonic could very well be the cause of change of timbre in the sub 18Khz range.
Ever thought about that ?
The file for instance that Elektroj has supplied, contains some almost deafening drum passages om my ESL’s, not in volume but in fast attack, despite the fact that it was played at 44.1/16.
And don’t say at forehand that your speakers are beyond suspicion, you may be surprised how fast an electrostat responds to an attack.
Hans
The new Quads have a lot going for them. Controlled dispersion, ruler flat freq response, fast transient time and very low thd. What more could one want? Dynamic range and bass extension. The M2 has better control of dispersion... no back radiation issues. Greater dynamic range and no compression on peaks; the main issue for me with the QUADs. M2 also has low distortion and fast, flat power response. All, qualities I deem as helping to contribute to accurate reproduction.
I sent the QUAD to Bangkok a couple years ago. Unfortunately, the electrostatic speaker cannot exist in a high humidity invironment - cause the HV to break down/leakage of the HV DC voltage. Now I am in Bangkok but now the M2 is still in calif !! 😱 So, I cannot do any new tests right now.
-Richard
Last edited:
It isn't, and any filter cannot change that. You are still mistaking the peak magnitude point of the filtered response as the point where the carrier freq is situated, which is only true when no additional EQ is present, obviously. With EQ, the peak point in the spectrum does shift but the carrier and the sideband frequencies are not changed. In a single cycle of raised cosine window the components have widespread leakage, in the periodic equivalent we see distinct lines at 20k carrier and 15/25kHz lower sidebands and that picture doesn't change when additional EQ is applied to this.
Print your graph out, the one I questioned.
Take a caliper, measure the zero crossing distances, first green, then blue.
My printer on an 8.5 by 11 sheet shows blue zero crossings at 24.54mm, green zero crossings at 22.19mm.
Had you slid them to coincide center of wave, you would see that they are not the same.
Oddly enough, they show the filter out as 18.08 khz carrier.
jn
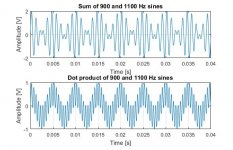
Here are the calculation results of the summation and modulation processes for a pair of unity amplitude sines with the respective frequencies of 900 and 1100 Hz. The sampling rate was 44100 Hz
The time domain plots show different signal shapes, the 1 kHz repetition rate of the sum is clearly visible (upper plot).
Modulation was calculated as the dot product of the two time series. According to theory, it should only produce the sum and difference of the two signals.
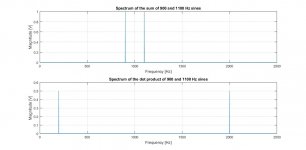
Shown on the second attachment are the respective spectra.
There is no energy at the intermediate frequency of 1 kHz in the summation case.
The spectrum of the modulation process displays only the two frequencies mentioned above, each with the half of their original amplitudes.
Hope this is of some help.
Regards,
Braca
The time domain plots show different signal shapes, the 1 kHz repetition rate of the sum is clearly visible (upper plot).
Modulation was calculated as the dot product of the two time series. According to theory, it should only produce the sum and difference of the two signals.
Shown on the second attachment are the respective spectra.
There is no energy at the intermediate frequency of 1 kHz in the summation case.
The spectrum of the modulation process displays only the two frequencies mentioned above, each with the half of their original amplitudes.
Hope this is of some help.
Regards,
Braca
Attachments
- Status
- Not open for further replies.
- Home
- Member Areas
- The Lounge
- John Curl's Blowtorch preamplifier part III