Hi, Mr. Kimmo, you have a excellent software. Please if you like to help me a little.
I have some doubt about power of the speaker build in speakers crossovers.
I see diffrent power in power dissapation window and in enclousure window.
For example like in pictures I was posted here, midrange speakers parallel conected.
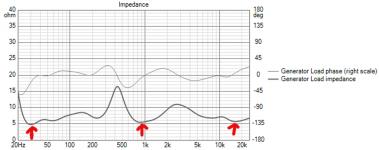
Second question is about impendance, like in the picture, finel impendance of speaker will be about 5 ohm like in picture, or middle calculation of max and min impendance in picture shown, for example.
I have some doubt about power of the speaker build in speakers crossovers.
I see diffrent power in power dissapation window and in enclousure window.
For example like in pictures I was posted here, midrange speakers parallel conected.
Second question is about impendance, like in the picture, finel impendance of speaker will be about 5 ohm like in picture, or middle calculation of max and min impendance in picture shown, for example.
Attachments
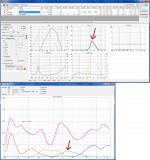
^You're using main program and Enclosure tool kinda wrong way round. You should not feed filter transfer function from main program to Enclosure tool for other reasons than testing excursion and power requirement of subwoofer driver with e.g. Linkwitz Transform.
Power dissipation window shows watts of individual drivers. Enclosure tool shows total power of all drivers (2 in your case). In addition, enclosure tool has -3 dB attenuation by filter transfer function from the main program. Combination of those two explains 4:1 ratio of power readings when both tools have the same voltage (40 V).
Impedance curve in Enclosure tool includes driver simulation only. Two drivers in parallel without crossover in your example.
Thanks, for the answer, I didnt understand your comment about transfer function well.
Like I understand, in power dissapation window, max power curve for some driver is actually used power (W) for that driver,
so for example this driver have 60w rms power and like I see in the picture is safe to handle with 40V.
Like I understand, in power dissapation window, max power curve for some driver is actually used power (W) for that driver,
so for example this driver have 60w rms power and like I see in the picture is safe to handle with 40V.
Attachments
Last edited:
Like I understand, in power dissapation window, max power curve for some driver is actually used power (W) for that driver,
so for example this driver have 60w rms power and like I see in the picture is safe to handle with 40V.
You can see power dissipation of drivers with given signal maximum, crest factor and spectrum (flat or pink with given corner frequency).
"Is it safe" depends on many things. For example is music signal you feed to speaker close to your estimation of crest factor and spectrum, and what maximum power (standard) is given by manufacturer. Quite safe (=pessimistic) to give crest factor = 6 dB and signal spectrum = pink above 3 kHz, and compare result to long term maximum of driver. Power dissipation with continuous flat sine is not useful in practice.
So this window should be adequate. I don't no better applications but that doesn't tell much 🙂
I did notice a tiny user error...
That's okay. This is the most common user error for sure and therefore response file naming requirements are written in at least three different places in VCAD documentation; user manual, measurement preparations and software page.
It has happened that most of customer support cases were solved by copy-pasting from existing public document to e-mail or discussion forum. That has not been very motivating 🙂 Therefore "How to start working with VituixCAD" was finally written. Easier to link to one paragraph and tell that "You are on your own if help documents are ignored and recommended design procedure and methods are not followed" if too busy or tired to give perfect answer.
Thanks kimmosto for the answers, and oneminde for your suggestion, I forgot to say its four driver speaker sistem, woofer, low midrange, high midrange, high parallel midrange driver work obout 900 to 3000Hz.
I am fighting with this crossover about 3 week... 🙂
Thanks
I am fighting with this crossover about 3 week... 🙂
Thanks
Last edited:
I am fighting with this crossover about 3 week... 🙂
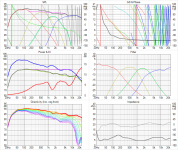
Do you have any chances to follow instructions and recommended design procedure in "Checklist for designing a loudspeaker" section in user manual? I can see that you have simulated all responses for crossover design. That is okay for some theoretical studies, but not for actual speaker. Preliminary XO engineering is not needed.
Also response tracing is not so good idea. It's usually just extra weight in simulator - confusing and misleading new designers to waste time for creating data for crossover design if final construction is not compatible with measurement baffle of driver manufacturer.
A lot of thanks, mr Kimmo, I forgot a basic thing, drivers are measured in flat baffle with some crossovers already in a fabric.
Will make measurments in my box and all crossovers again, a 3 week lost ... but good training for the soft.
Thanks again, Dean
Will make measurments in my box and all crossovers again, a 3 week lost ... but good training for the soft.
Thanks again, Dean
Minor changes done to VituixCAD Measurement Preparations pdf.
Sampling rate recommendation changed from 48k to 88.2k to avoid response extrapolation when txt/frd is read to VituixCAD main program or tools. 48k is still okay (and provides better S/N) if measured driver does not have significant break-up peak close to 24 kHz.
Verified that document is valid also for new ARTA and LIMP revision 1.9.2.
PIR file format of ARTA 1.9.2 has changed a bit, but it doesn't have effect to function of Convert IR to FR tool. Support of new PIR verified with the latest build of 2.0.13.8 (2019-04-17).
Last edited:
...the latest build of 2.0.13.8 (2019-04-17).
Main program
* Fixed crash when active buffer was replaced with some other active block by Ctrl + click new component.
Enclosure
...
* Qtc of Closed box analyzed from impedance response. Calculated Qtc is shown as tooltip of Volume [l] text box in Enclosure tab and in the end of text box in Info tab.
* Fb and calculated Qtc of Closed box updated to fo and Qo parameters of selected (top component) Active Linkwitz Transform block in crossover in the main program if 'Crossover of driver:' is checked in Align tab.
^Should be close to exact match with 0% component tolerances and without mutual inductance effects, and without differences in drivers' impedance response measurement compared to transfer function measurement.
^Should be close to exact match with 0% component tolerances and without mutual inductance effects, and without differences in drivers' impedance response measurement compared to transfer function measurement.
"In theory, there is no difference between theory and practice. But, in practice, there is."
It's reassuring that Vituix and the Monkey Coffin are an exception to this. 😀
Hi everybody,
I'm new in the audio DIY and recently I have started to play with the vituixCAD2. I'm learning by doing and now I'm facing a problem and asking you for a little help.
When I use the SPL Trace tool for some drivers I'm getting the message:
Frequeny responses of drivers do not incloude Reference angle 0 (or -88) deg hor.
A've tried many times and ways but I dont know how to solve this problem.
Thank you in advance!
Djoki
^This one was answered just four days ago. Please follow "How to start working with VituixCAD" to stay in correct path: post #1060
Thanks for the updates again kimmosto!
Another question, is it actually possible to give individual drivers some delay in the diffraction tool?
Or do I have to export each individual response and merge them all together?
I am figuring out a way to simulate a CBT line array.
Another question, is it actually possible to give individual drivers some delay in the diffraction tool?
Or do I have to export each individual response and merge them all together?
I am figuring out a way to simulate a CBT line array.
bug report and feature request
Dear Kimmo,
I'm enjoying using VituixCAD - it has a great balance of ease of use and capabilities!
Bug report:
I've noticed for the last several versions, that double-clicking on the "power" graph doesn't zoom it as expect, but rather makes it very small and unreadable. All the other graphs seem to work ok.
Feature requests:
1. Is it possible to add export capability for the numerical data in each of the graphs? Easiest would be to export ALL the data being plotted in all 6 graphs. A single "export 6 pack data" in the context menu making a multi-column text file perhaps?
2. It would be useful to add "inbox SPL" to the SPL graph (optional to show to avoid cluttering the graph). This is helpful to know when there is high pressure to get an idea how much bracing would be needed to make box walls stiff, for example. Sometimes I have seen inbox SPL over 160dB.
3. One more output I would like to see would be the reaction force from the moving mass of the speaker, in Newtons. This plot is useful to predict how much the speaker may "walk" on the floor due to vibrations being transmitted due to F=ma where m is the Mms, and a is the cone acceleration. The easiest way to calculate this force is to derive it from the excursion curve by F = Mms x (2*pi*Freq)^2 x Excursion. I suggest plotting it on the excursion graph with 2nd Y axis in Newtons, and allow the user to enable if desired with right mouse click, similar to what is already done for "show effect of inductance" checkbox.
Thanks for creating such an excellent software tool!
Another question, is it actually possible to give individual drivers some delay in the diffraction tool?
Or do I have to export each individual response and merge them all together?
I am figuring out a way to simulate a CBT line array.
Delay would work for axial response only.
CBT is simulated so that single driver is simulated with diffraction tool, off-axis responses are exported - and imported for single driver in the main program. Complete array is built in crossover with Driver layout window. That has calculator for CBT too (see green dots in right view):
An externally hosted image should be here but it was not working when we last tested it.
- Home
- Design & Build
- Software Tools
- VituixCAD