Apparent deficiencies of these models:
The 2SC6145 model has higher apparent Re at higher currents due to difficulty in modeling the curve in the datasheet. Furthermore, the high value of Nk may cause convergence or solver errors. Removing Nk should fix this, and the majority of Hfe droop is due to quasi-saturation anyway.
(I'm sure there are more deficiencies, but those are the apparent ones.)
.model 2SC6145-Y_kq NPN ; Revision 3 by keantoken - March 1 2019
+ Bf=93 Br=8 Re=8m Rc=16m
+ Rb=4 Rbm=0 Irb=0.3 Vaf=1000
+ Is=5p Ise=200f Ikf=200 Nk=1.9
+ Rco=0.68 Gamma=255n Vo=100 quasimod=1 Qco=100p
+ Tf=2.45n Cje=9.7n Cjc=880p Vje=0.68 Mjc=0.48 Fc=0.9
+ Xtf=30 Itf=15 Vtf=0.95 Xtb=0.9 Eg=1.16
+ Vceo=230 Icrating=15A mfg=Sanken
.model 2SA2223-Y_kq PNP ; Revision 3 by keantoken - March 1 2019
+ Bf=99 Br=8 Re=10m Rc=18m
+ Rb=2.38 Rbm=0 Irb=0.9 Vaf=500
+ Is=3.5p Ise=50f Ikf=3 Nk=0.15
+ Rco=395m gamma=14n Vo=30 quasimod=1 Qco=100p
+ Tf=3.65n Cje=8.3n Cjc=1.6n Vje=0.68 Mjc=0.48 Fc=0.9
+ Xtf=50 Itf=110 Vtf=2.6 Xtb=1.4 Eg=1.16
+ Vceo=230 Icrating=15A mfg=Sanken
Revision 3 - Updated Ft behavior with measure capacitance values thanks to astx.
Attachments


Last edited:
Hi keantoken,
many thanks for it! I use this parts long time ago, but i never had chance to correctly simulate them...
Sajti
many thanks for it! I use this parts long time ago, but i never had chance to correctly simulate them...
Sajti

.model 2SC6145-Y_kq NPN ; First revision by keantoken - Feb 27 2019
+ Bf=93 Br=8 Re=8m Rc=16m
+ Rb=4 Rbm=0 Irb=.3 Vaf=1000
+ Is=5p Ise=200f Ikf=200 Nk=1.9
+ Rco=.68 Gamma=255n Vo=100 quasimod=1
+ Tf=2.6n Cje=14n Cjc=380p Qco=100p
+ Xtf=50 Itf=16 Vtf=0.8 Xtb=0.9 Xti=4.5
+ Vceo=230
.model 2SA2223-Y_kq PNP ; First revision by keantoken - Feb 27 2019
+ Bf=99 Br=8 Re=10m Rc=18m
+ Rb=2.38 Rbm=0 Irb=.9 Vaf=500
+ Is=3.5p Ise=50f Ikf=3 Nk=.15
+ Rco=395m gamma=14n Vo=30 quasimod=1
+ Tf=3.9n Cje=12n Cjc=750p Qco=100p
+ Xtf=50 Itf=140 Vtf=3 Xtb=1.4 Xti=4
+ Vceo=230
More first impressions.
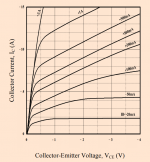
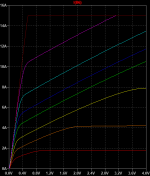
The Vce / Ic plots look like a pretty nice fit, well done!
Same comments about RBM as in other thread so I won't repeat.
RE to RC ratio seems believable even if the values seem low.
VAF=1000 seems a bit hi for a 230 V transistor, presumably based on extrapolation of a very shallow line, accurate?
It's consistent with the PNP which is probably the main point.
IKF=200 seems hi, data?
XTI=4.5 or 4 is odd when the default is 3 and usually well predicted, data?
Best wishes
David
Last edited:
The Vce / Ic plots look like a pretty nice fit, well done!
Thank you.
XTI=4.5 or 4 is odd when the default is 3 and usually well predicted, data?
Best wishes
David
It was based on datapoints digitized from the datasheet chart, but I used the wrong parameter to fit. I have fixed it.
On the 2SC6145 model, the transconductance droop at high currents is still too high despite most of Rbe coming from Rb. Any significant value of Rbm will worsen the fit.
Last edited:
Could I repeat my question from the other thread and ask where the RC value comes from?
Cordell doesn't discuss how to determine it, and it's not obvious to me that any of the usual datasheet plots are useful.
Best wishes
David
Cordell doesn't discuss how to determine it, and it's not obvious to me that any of the usual datasheet plots are useful.
Best wishes
David
You can first fit Rbe (from the Vbe plot) and Ron (from the Ic plot), with the starting assumption Re=Rc/2 (which you will recognize).
Re=Re
Rb=(Rbe-Re)*Bf
Rc=Ron-Re
This allows you to vary Re (and hence Rb and Rc) without disturbing (too much) the constants Rbe and Ron. You could of course rearrange these relationships to take Rb or Rc as the input instead.
Presumably at this point you would go off and model Hfe and saturation behavior. Then you would come back and and adjust Re, Irb and Rbm to get the Vbe fit right. But for half of all power transistors (at least the ones I've tried) you will never get it right. So it remains to use good judgement in managing error. As you may have noticed I ended up leaving Re and Rc at near their initial values.
Page 27 here gives a method for extracting Re:
http://www.idea2ic.com/PlayWithSpice/pdf/G U M M E L - P O O N.pdf
I would improve that method by using a CCS load for the collector. On page 94 there are additional methods for Re and Rc.
You can first fit Rbe (from the Vbe plot) and Ron (from the Ic plot)
...there are additional methods for Re and Rc.
Yes, I read the methods in the notes, what I wondered about was what method you used to determine it from the datasheet.
I see the derivation of RC + RE from the saturated line in Vce versus Ic plot, thanks.
I don't follow the next bit, how does the SC3264 model end up with RE that's 38 times the size of RC?
Can you be more specific, how to fit what on the Vbe plot?
I expect you have this version of the datasheet
Open in a new tab to see it (not sure if there's a easy way around that)
Best wishes
David
Last edited:
The results at -9V vBC (via a 100k resistor) for
My smart-tweezer ST5 uses a 10k frequency and 0.25Vrms test signal
BR, Toni
- 2SC6145AY: 325pF
- 2SA2223AY: 540pF
My smart-tweezer ST5 uses a 10k frequency and 0.25Vrms test signal
BR, Toni
Attachments
The results...
The predicted/simulated value...
Hi Toni
You probably understand this as well, or better, than anyone.
Can you work out Keantoken's post #10 on how to split up Rce between Rc and Re?
If you can then please explain, and if you can't then tell me so I feel better that it's not just me😉
Best wishes
David
I don't follow the next bit, how does the SC3264 model end up with RE that's 38 times the size of RC?
Why does the 2SC3264 have rising Gm at 17A (according to the Vbe plot) while in quasi-saturation where Hfe is dropping like a bomb and Ib is increasing dramatically? That is really what is causing all this.
Rb is small because if it is large, quasi-saturation dominates over the upper current region where Gm should be rising, not falling (according to the datasheet). Re is large because it must contribute the bulk of Rbe due to Rb being small. Rc is small because Re is close to Ron and if it were large, Ron would be incorrect. If we reduced Re to allow a larger Rc, then we would lose our high current Gm fit due to Rb needing to be large again for Rbe. This is what fits the datasheet best, although it's still not a very good fit. The model just doesn't have the functions that would make it work, can you think of a parameter we could plausibly use to model forward transconductance besides Re, Rb and Irb/Rbm?
The Vbe chart says Tc, not Tj so I tested the idea that junction heating resulted in higher current at the end of the plot. It would have required that Rbe be negative to fit the model, so I don't think so. It is probably a pulsed measurement.
Why does the 2SC3264 have rising Gm at 17A (according to the Vbe plot) while in quasi-saturation...?
My suspicion would be bad data.
Of course, our work should be based on facts and not suspicion, expectations or assumptions.
But I would be be cautious about that plot, it looks odd for all the reasons you mention, seems unlikely to kick up as the transistor enter quasi-saturation.
There's a rule of thumb in statistics and science to be cautious of data towards the end of a plot - the plot ends because the data couldn't be collected any further, so the data just before that is usually a bit unreliable.
In this case it looks like an ill conditioned problem, where a small bend at one extreme has tilted the whole fit.
Could be true of course, I would be very interested to see actual measurements of Rc and Re done in accordance with the document you referenced.
If anyone has a spare 2SC3264 to loan then I could "dirty my hands" to do it😉
But probably easier for someone in the USA, you?
Best wishes
David
Last edited:
Even if the upward bend is false, we still wouldn't have much data to determine the proportions of resistances from the datasheet. Funny, I was looking at a Tektronix curve tracer on Ebay.
Even if the upward bend is false, we still wouldn't have much data to determine the proportions of resistances from the datasheet.
Yes, that was more or less my point.
A model which has values far different from inherent transistor properties requires some pretty solid data - extraordinary claims require extraordinary evidence and such.
I am more inclined to trust the basic principles of semiconductor physics than a datasheet.
Most manufacturers can't even do a reasonable Spice model so they are obviously far from infallible.
...a Tektronix curve tracer on Ebay.
Australia is a fine place to live but I do feel a little envious of your second hand electronics market, buy it.
Best wishes
David
Ps. I don't think RE = RC/2 is necessarily what to aim at, more of a limit, RE is typically much smaller, maybe a tenth?
Perhaps we can involve Scott Wurcer? There's a man who would know.
Last edited:
Thx - hmm - I give my best, but I'm still at an early learning stage regarding spice model design... got the chance to get the book from "Joerg Berkner - Kompaktmodelle für Bipolartransistoren" which explains modeling parameters very good but is also more IC centric.Hi Toni
You probably understand this as well, or better, than anyone.
Can you work out Keantoken's post #10 on how to split up Rce between Rc and Re?
If you can then please explain, and if you can't then tell me so I feel better that it's not just me😉
...
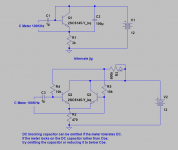
- To measure capacitances correctly as well as other parameters I have ordered a new LCRZ meter which has test levels as low as 10mV rms.
- ... need to design a microcontroller powered constant current source to measure RC and RE using the flyback method.
- The Keithley SMU's 236/237/238 on ebay are too expensive for me.
- The Tektronix 576 curve tracers on ebay may work, but have no interface to automate the testing by PC.
- The Sony Tektronix 370 looks nice and has a GPIB port, but is far too expensive ...
- Locky_z curve tracer are not available
- The Syscomp CTR-201 would be in my budget but is currently not available...
Last edited:
Dear keantoken,
have randomly choosen 4 parts each out of my stock of 2SC6145A and 2SA2223A and tested them with no bias voltage with my ST2830 LCRZ. Sett to slow measurement and averaged always 2 measurements.
Attached are the results.The data files have unix line end.part mv kHz cap nF Rser Ohm
have randomly choosen 4 parts each out of my stock of 2SC6145A and 2SA2223A and tested them with no bias voltage with my ST2830 LCRZ. Sett to slow measurement and averaged always 2 measurements.
Attached are the results.The data files have unix line end.part mv kHz cap nF Rser Ohm
2SC6145A-BC-1 10 10 0.870n 4.977
...
BR, Toni...
Attachments
I thought I saw a pattern in the data but I was unable to find an obvious correlation in the spreadsheet. I thought Rb would correlate with Ib and that would allow us to infer Irb.
2SC6145A Rb correlation - Google Sheets
EDIT: What I see is that for the first 3 mV settings, Rb decreases with Ib. It's slight but seems to be consistent. Here it is with the 100mV test excluded. There looks like a correlation but there's not enough data:
2SC6145A Rb correlation 2 - Google Sheets
It seems not. Oh well. I can still optimize Irb using the Vbe chart, when I get the time. Another way to infer Irb might be to have a second Rb measurement at 4mA. It would require a bias circuit. At 4mA Rin is high enough that it probably won't interfere with the measurement. Jigs attached. For the second jig, Vbe should be matched within something like 2mV. No hurry.
In a model that better reflected the physics of the actual silicon, I wonder if Rbc would be a good starting point for Rco?
Attachments
Last edited:
- Home
- Design & Build
- Software Tools
- LTspice models for Sanken 2SC6145/A2223