The total acoustic power radiated by two point sources depends not only on the strength of the individual sources, but the distance between them and their relative phase. Imagine placing a large sphere around the sources and taking virtual microphone measurements all over the sphere. Then integrate the sound intensity (which is proportional to the square of the volume velocity) over the area of the sphere. This gives you the total acoustic radiated power of the two source system.… If this is just algebraic addition of acoustic powers from two point sources, then this sum will not depend on the distance between them.
See equation 3.3 in this article on sound radiation:
(PDF) Radiation of sound
Where is this source located?
As previously indicated, the source is located 1 metre from the observation point. Hopefully post #8521 by bolserst and the document he links to, will help to clarify things for you. There is really nothing further that I can add to his comments, except to say that it is important to remember that Hornresp is calculating power response, not pressure response.
As far as measuring the response of an actual constructed system is concerned, where to place the microphone in relation to the two sound outputs is a judgement decision that only you can make. Personally, I would probably assume that the notional "single point source" was at the mid-point of the straight line connecting the two outputs, and then locate the observation point as far away from the loudspeaker enclosure as I reasonably could, normalising the measured results back to the standard reference distance of 1 metre. Others with more practical experience in such matters may care to comment further.
Last edited:
Sounds fine to me. 🙂
I will update the export code of the Semi-Le spreadsheet in the next update.
See equation 3.3 in this article on sound radiation:
(PDF) Radiation of sound
Thank you Sir 🙂
bolserst, David McBean
Thank you, it became clearer to me.
Next question. As can be seen in the figure in post #8518, this is a typical response of a quarter-wave resonator with a shift of 1/3. This decreases the mode 3F. To lower the rest of the modes, usually filling is used. However, there is still a solution: one or two Helmholtz resonators. They are adjusted to 5F and 7F. Such solution I saw in Visaton, but forgot to keep the partnumber. This solution allows you to emulate the program AJHorn.


Is it possible to add such function to Hornresp?
Thank you, it became clearer to me.
Next question. As can be seen in the figure in post #8518, this is a typical response of a quarter-wave resonator with a shift of 1/3. This decreases the mode 3F. To lower the rest of the modes, usually filling is used. However, there is still a solution: one or two Helmholtz resonators. They are adjusted to 5F and 7F. Such solution I saw in Visaton, but forgot to keep the partnumber. This solution allows you to emulate the program AJHorn.
Is it possible to add such function to Hornresp?
Is it possible to add such function to Hornresp?
Not without a massive amount of work. It's not going to happen 🙂.
Orion33 you can simulate those Helmholtz resonators along the quarter wave line with Transmission line software
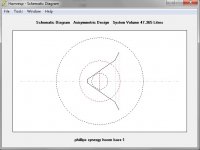
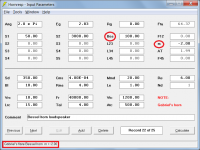
Ho David, long time not hear me, Oke I have a question, if you look at picture, is the red circle the speaker cone? and as you see the port is big? this is much to big for this horn or how I have to interpretere it.
The result looks goed but I think it is not possible in real.
thanks.
The result looks goed but I think it is not possible in real.
thanks.
Attachments
Last edited:
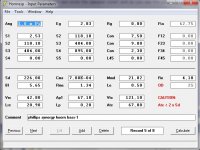
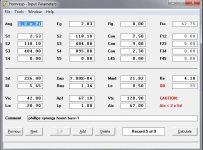
How can you have a rear port length (Lp = 0.20 cm) less than the thickness of wood?
0.75 in = 1.905 cm = 19.05 mm.
0.75 in = 1.905 cm = 19.05 mm.
Ho David, long time not hear me, Oke I have a question, if you look at picture, is the red circle the speaker cone? and as you see the port is big? this is much to big for this horn or how I have to interpretere it.
The result looks goed but I think it is not possible in real.
thanks.
Hi Kees,
1. The dotted red circle shows the total area of the two driver diaphragms, that is, 2 x Sd.
2. Because Atc and Ap1 have been specified as having effectively the same area, the values for Ap1 and Lp can be set to zero. The port serves no purpose in this case, apart from increasing the throat chamber length by 0.2 cm, which makes no practical difference to the results anyway.
Kind regards,
David
How can you have a rear port length (Lp = 0.20 cm) less than the thickness of wood?
0.75 in = 1.905 cm = 19.05 mm.
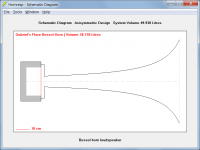
I had not used hornresp for a long time, I did always adjust for thickness of wood, but I see I need to play from time to time with hornresp because it get more advanced with the day, very good done David, it looks really good.
Here it is 1,80 long but need to get use to it again, however it is be lazy time here, today a nice cool day after thunderstorms and 38 oC
regards
Attachments
Last edited:
A router? 😀How can you have a rear port length (Lp = 0.20 cm) less than the thickness of wood?
0.75 in = 1.905 cm = 19.05 mm.
Hi Kees,
1. The dotted red circle shows the total area of the two driver diaphragms, that is, 2 x Sd.
2. Because Atc and Ap1 have been specified as having effectively the same area, the values for Ap1 and Lp can be set to zero. The port serves no purpose in this case, apart from increasing the throat chamber length by 0.2 cm, which makes no practical difference to the results anyway.
Kind regards,
David
Thanks David, I have correct it, and adjust the others for thickness of wood, in mine case 1,80 cm, is dat the richt way?, I did delete the Atc and lp and it have no different action.
The result for this old phillips speaker is quite oke, but it that fot this way, I do not now, as your program do center the port while when build it, the port is shifted because of this problem of fitting the speaker.
regards
Hi Kees,
It all depends on whether or not you want to include a port having a different cross-sectional area to that of the throat chamber. If so, then specify the port using Ap1 and Lp. Otherwise just increase the value of Vtc to take the panel thickness into account.
Even if the port is offset in the actual enclosure, the predictions should still be reasonable.
Kind regards,
David
I have correct it, and adjust the others for thickness of wood, in mine case 1,80 cm, is dat the richt way?
It all depends on whether or not you want to include a port having a different cross-sectional area to that of the throat chamber. If so, then specify the port using Ap1 and Lp. Otherwise just increase the value of Vtc to take the panel thickness into account.
The result for this old phillips speaker is quite oke, but it that fot this way, I do not now, as your program do center the port while when build it, the port is shifted because of this problem of fitting the speaker.
Even if the port is offset in the actual enclosure, the predictions should still be reasonable.
Kind regards,
David
Hornresp Update 4700-180815
Hi Everyone,
CHANGE 1
Bessel horns can now be simulated.
Set m = 0 for cylindrical horn
Set m = 1 for parabolic horn
Set m = 2 for conical horn
Set m = 99999 for exponential horn
Set m = -2 for Gabriel's horn
The flaring index parameter m can be set to any integer value between -50 and 50 for infinite Bessel horns, and between -9999 and 99999 for finite Bessel horns.
My thanks to Bjørn (Dr Kolbrek) for his very valuable help during the development of the Bessel horn throat acoustical impedance model.
CHANGE 2
The Range tool can now be used with the acoustical impedance chart. Previously the tool was only available with the electrical impedance and group delay charts.
Kind regards,
David
Attachments

- Home
- Loudspeakers
- Subwoofers
- Hornresp