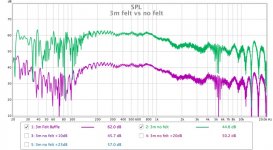
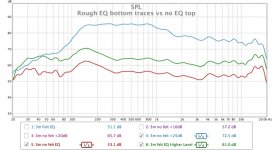
Interesting result. Almost smooth at 2m and 3m. The midbass hump has nearly vanished at 2m with slow taper towards treble. I would have expected the bass to roll off faster but it didn't.
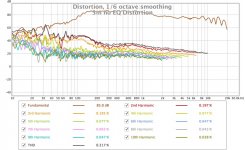
Distortion
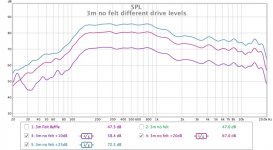
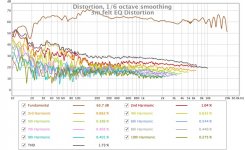
At these levels there is no distortion issue but I do need to get the level up when I take measurements indoors. Remember below 100Hz is corrupted by noise in most of these.
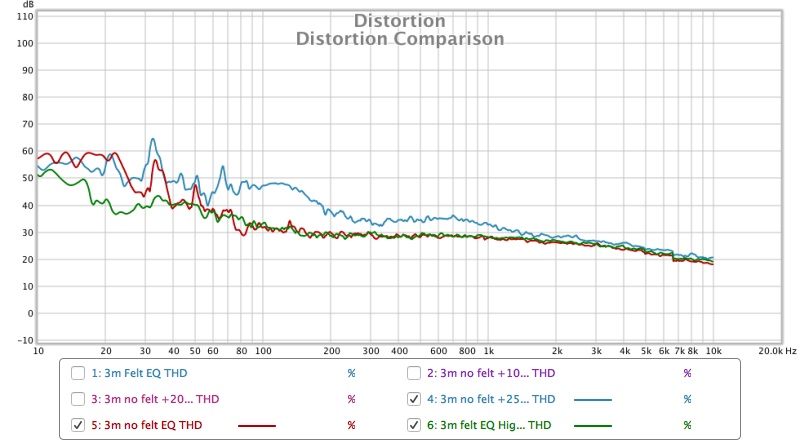

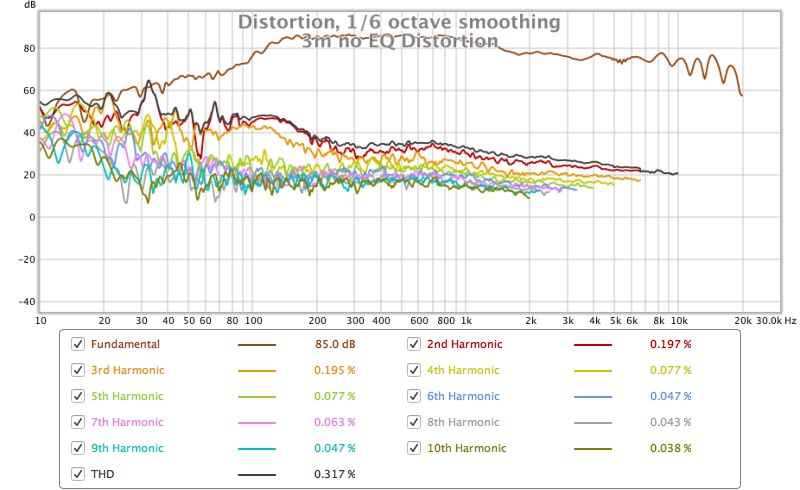
At these levels there is no distortion issue but I do need to get the level up when I take measurements indoors. Remember below 100Hz is corrupted by noise in most of these.
Attachments

Last edited:
Interesting result. Almost smooth at 2m and 3m. The midbass hump has nearly vanished at 2m with slow taper towards treble. I would have expected the bass to roll off faster but it didn't.
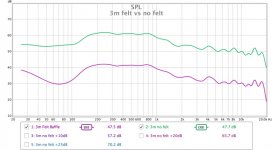
The only measurement I would trust to low frequencies is the green EQ'd high level trace. All the others have significant phase turn and ragged response caused by the noise.
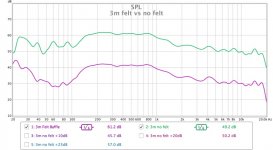
It is a bit hit and miss with outdoor measurements as they are subject to all sorts of variables outside your control. Some measurements are much cleaner than others. The ERB smoothing is an optimistic perspective at best below 100Hz 😉
What has attracted my attention was the felt/vs no felt measurement at 2 meters.
The notch and peak in the 10-20khz region seems to favor the no felt approach..
But those are not present in the 1m and 3 m measurement....
The notch and peak in the 10-20khz region seems to favor the no felt approach..
But those are not present in the 1m and 3 m measurement....
What has attracted my attention was the felt/vs no felt measurement at 2 meters.
The notch and peak in the 10-20khz region seems to favor the no felt approach..
But those are not present in the 1m and 3 m measurement....
The 3m measurements are the most reliable because the mic was not moved for those. It is possible that the others are not in exactly the same position relative to the speaker axis. I did try to make them as consistent as possible but with a speaker this big in the air it is difficult to be absolutely precise.
Either the IR or off axis measurements would be most telling for the action of the felt.
The FR will be lumped together with diffraction (if it's there). A single driver doesn't measure flat, so why should an array of the same drivers.
The top end shows the combing from the array and will introduce itself in different spots at different distances.
The FR will be lumped together with diffraction (if it's there). A single driver doesn't measure flat, so why should an array of the same drivers.
The top end shows the combing from the array and will introduce itself in different spots at different distances.
This SPL and Phase graph of the 3m Measurement with EQ where the level was up looks to be the most reliable, the phase is pretty good and there are no real wraps caused from measurement anomalies.
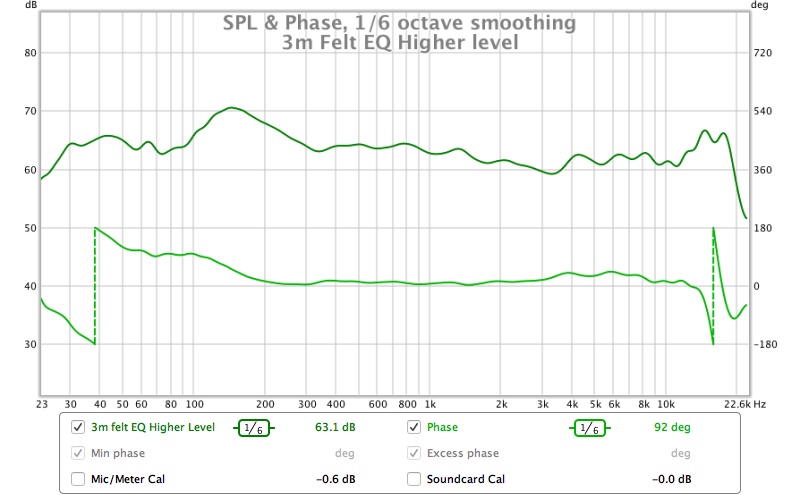
That's looking pretty good!
You can see in the outside picture that I had a cardboard wheel out with degrees marked but the speaker was too heavy to easily twist. I would need to make a dolly to take polar style measurements. I will post the impulse response but most still look a little weird.Either the IR or off axis measurements would be most telling for the action of the felt.
The FR will be lumped together with diffraction (if it's there). A single driver doesn't measure flat, so why should an array of the same drivers.
The top end shows the combing from the array and will introduce itself in different spots at different distances.
That's looking pretty good!
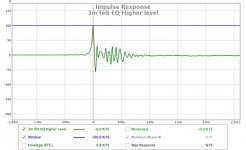
Thanks! Pretty happy how that one looks given that it was a guess EQ measured outside 🙂
This is the impulse for that one and it looks as I would expect.
Attachments
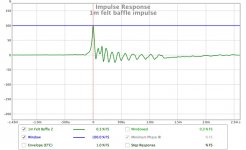
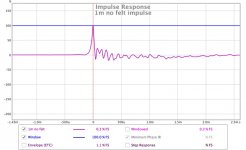
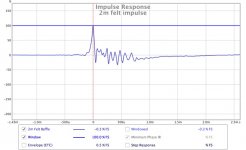
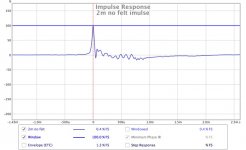
They don't look that bad to me, the closer you get, the bigger the difference between the center driver (in line with the mic) and the bottom and top driver. So you see longer ringing up close and shorter at 3 m where the difference in distance is reduced.
I don't recognize any benefit of the felt here though. Quite the contrary, the one without felt has lower ringing in both plots. That doesn't say much unless we start looking at the frequencies of interest. Remember, the IR is a chosen representation, to see more detail we need to dig deeper.
Just a thought: line arrays are good in averaging, I've stated that before. The thing to avoid is vertical planes at the same distance to each speaker as it won't be able to average that. If the felt is somewhat reflective, you've created a vertical plane at the same distance from each driver. I hope it doesn't work that way. It would explain the higher peaks after the main one in all of the felt measurements.
Last edited:
If you look at the impulse measurements all the ones that have a cleaner tail also have the cleanest initial rise. The noise in the measurements seems to show up here which is why I don't think the impulse plots are that helpful as to me the measurements are not necessarily clean and repeatable. The frequency responses above 100Hz look to be OK which is why I posted them first.
The thing I notice in the 1m plots is that the ringing from the one with the felt while bigger in amplitude is more even. The one without felt has many more small wiggles in between the main ringing train from the arrayed drivers. What do you think?
The felt is real wool saddle felt and should not be a particularly reflective surface. I suspect that due to the combination of the drivers it will not be easy to see the effects like it would be with a single driver.
There are only a couple of measurements there I feel confident in and I don't see any issues with them, they also happen to be the 3m measurements with felt.
I posted the measurements because I said I would, I'm not sure they really show the action of the felt that well.
I thought the outdoor measurements would represent a good baseline but it seems they are a difficult thing to take given the fact you can't control anything!
When I get to indoor listening position measurements then we start the real analysis and dig deeper into the plots 🙂
Last edited:
Hi fluid,
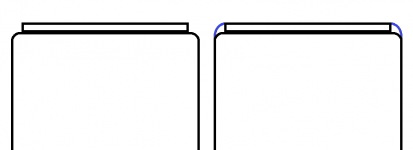
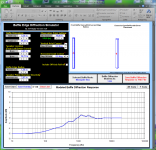
Thanks felt measurements, know below suggestion is going into small shoes but it shows little improvements, diffraction can be EQed out but it changes a bit with distances but changes a lot with angle, suggestion is you make small strip of felt that will increase your round over radius, into spreadsheet you see data for middle driver blue curve verse grey curve going from 1 inch radius to 1,5 inch radius.
Thanks felt measurements, know below suggestion is going into small shoes but it shows little improvements, diffraction can be EQed out but it changes a bit with distances but changes a lot with angle, suggestion is you make small strip of felt that will increase your round over radius, into spreadsheet you see data for middle driver blue curve verse grey curve going from 1 inch radius to 1,5 inch radius.
Attachments
Diffraction is also one of those great audio bugaboos that gets a lot of attention and yet, it has been claimed by people such as Toole that it is inaudible. As BRYTT mentions, the peaks and dips change from small changes in location. This is precisely the type of response that our brain is able to filter out. It irritates the eyes more than the ears.
It seems as though you're missing the fundamental point though, which is that wiring drivers sharing a common volume in parallel results in lower deltas between the excursion of those drivers. This could become a significant issue, even with these little drivers, at higher output levels.
Thanks for the response, Owen. Why is it important to have the excursion of each driver sharing a volume be the same? Is it because there is a chance in some high excursion scenario that one of the drivers might blow up?
Diffraction is also one of those great audio bugaboos that gets a lot of attention and yet, it has been claimed by people such as Toole that it is inaudible. As BRYTT mentions, the peaks and dips change from small changes in location. This is precisely the type of response that our brain is able to filter out. It irritates the eyes more than the ears.
Agree points in case where system is calibrated at listening position that staying safe there it doesn't matter much, but wouldn't it be nice when moving around that sweet spot performance stays as close as possible into new locations.
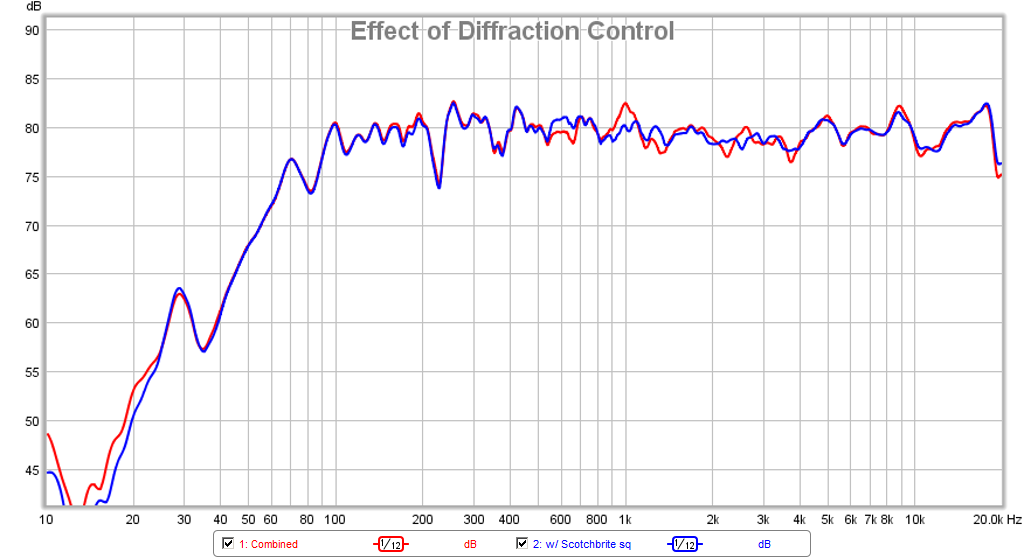
I used 3M Scotchbrite scouring pads around my fullrange "dome" tweeter in a FAST setup and took measurements. They made the 600Hz to 3kHz range smoother in frequency space due to reduced diffraction. Maybe 1 to 2 dB little peaks (like grass) were smoothed out flatter. It was very subtle, but audible and measurable. As Byrtt says, increasing the roundover coverage will help.
http://www.diyaudio.com/forums/full-range/280331-fr58ex-ac130f1-micro-fast-9.html
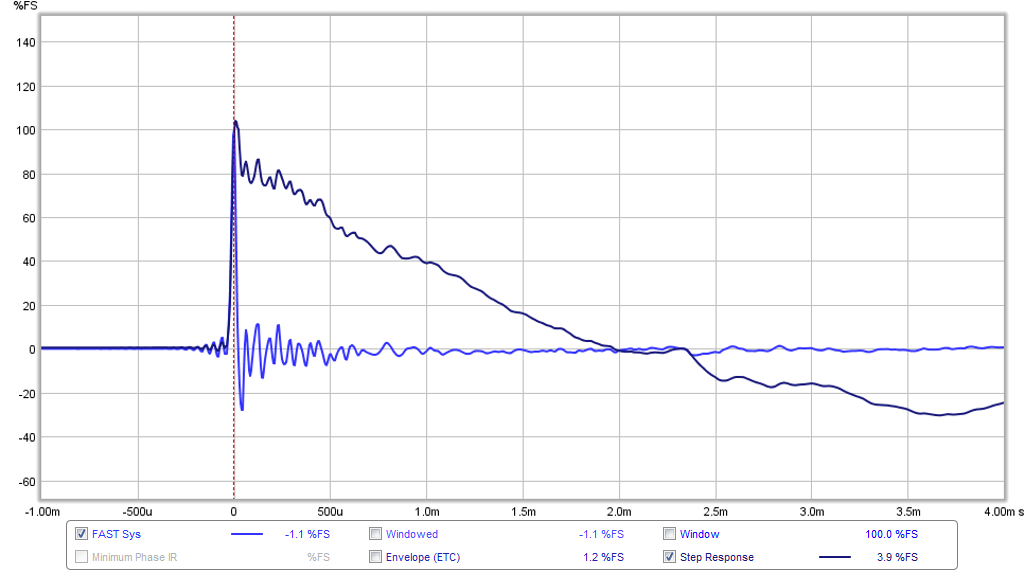
Here was the impulse and step:
http://www.diyaudio.com/forums/full-range/280331-fr58ex-ac130f1-micro-fast-9.html
Here was the impulse and step:
Last edited:
fluid,
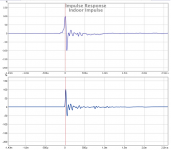
Maybe it means nothing but notice your IR have kind of soft take off at attack side of IR, same had xrk971 before he went from think it was Dayton UMM-6 to miniDSP UMIK-1 USB microphone. Could it be sample rate converting inside Windows or hardware sample rate converting in your chain somewhere, below visual show what i mean in upper one is your single driver from post 394 verse lower one that is mine TC9 single driver measured in 192kHz chain and scaled as close to yours as eye could tweak.
Maybe it means nothing but notice your IR have kind of soft take off at attack side of IR, same had xrk971 before he went from think it was Dayton UMM-6 to miniDSP UMIK-1 USB microphone. Could it be sample rate converting inside Windows or hardware sample rate converting in your chain somewhere, below visual show what i mean in upper one is your single driver from post 394 verse lower one that is mine TC9 single driver measured in 192kHz chain and scaled as close to yours as eye could tweak.
Attachments
Hi OPC,
Sure, give me a day or two...xrk971,
Could you do me a huge favor and run the simulations again with two small (and presumably simple) changes?:
1. Change rear volume to 2L per driver. This is more representative of what myself and fluid are using.
2. Change input voltage to 9V for the parallel case and 45V for the series case. Running 3V in the parallel case works out to 28W for the entire array, and they require a whole lot more power than that. 9V works out to more like 250W which is what I needed to get down to 20-30Hz at decent output levels in a mid-sized room. It's still quite a bit less than the maximum power capacity of the array.
I think these two changes will help to better demonstrate the issue. All I need to see are the excursion graphs.
- Home
- Loudspeakers
- Full Range
- Full Range TC9 Line Array CNC Cabinet