...the high HF isn't getting linearized because that slope isn't covered by rephase - it only does the XO in this mode; I guess I should cover it paragraphically and fill in those dips while I'm at it
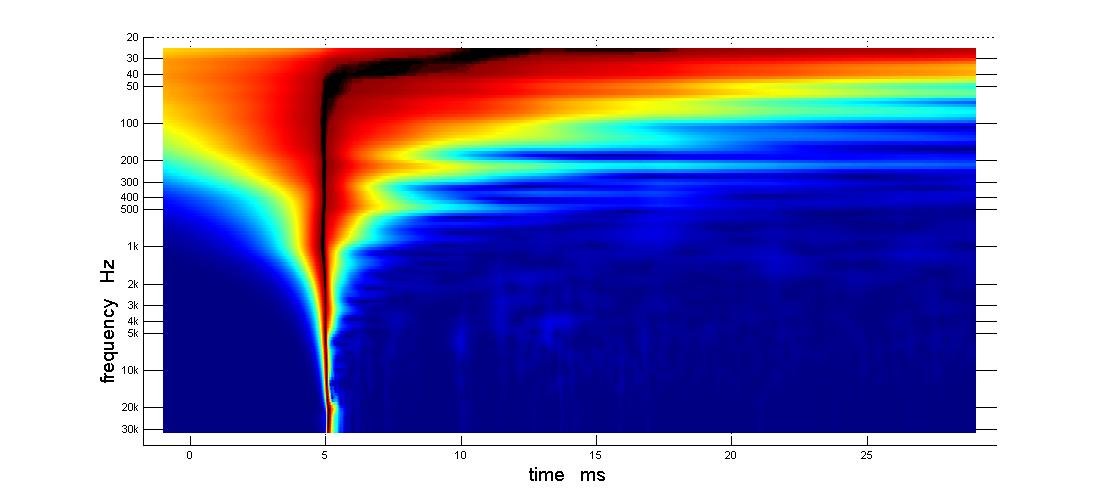
TDA plot looks really nice but easyer to read how strait frq domain line is in 2d TDA pl, into REW phase can maybe look a little overcompensated which could be calibrated with a little change in frq for filter into Rephase, but it could also be as simple as hit button "Estimate IR Delay" and HF phase fall in place.
Thanks pl plot in general think it looks on track as good as never before 🙂 but take your time down the road and get small details investigated.
Have a couple of thoughts, first is it can look as tweeter would need a little bit less delay when added a guiding strait white line into pl plot and also into SR when having a downward tonal curve shall show rounded off peak of SR verse the flat tonal curve that is sharp. So maybe try little less delay for tweeter and see if pl plot gets more strait at frq axis and SR starts show rounded peak.

Second if first don't help is guess you have 1050Hz 8th order FIR linearization set in Rephase, try set it down to 6th order and see if it helps for phase track.
Have a couple of thoughts, first is it can look as tweeter would need a little bit less delay when added a guiding strait white line into pl plot and also into SR when having a downward tonal curve shall show rounded off peak of SR verse the flat tonal curve that is sharp. So maybe try little less delay for tweeter and see if pl plot gets more strait at frq axis and SR starts show rounded peak.
Second if first don't help is guess you have 1050Hz 8th order FIR linearization set in Rephase, try set it down to 6th order and see if it helps for phase track.
Attachments
Last edited:
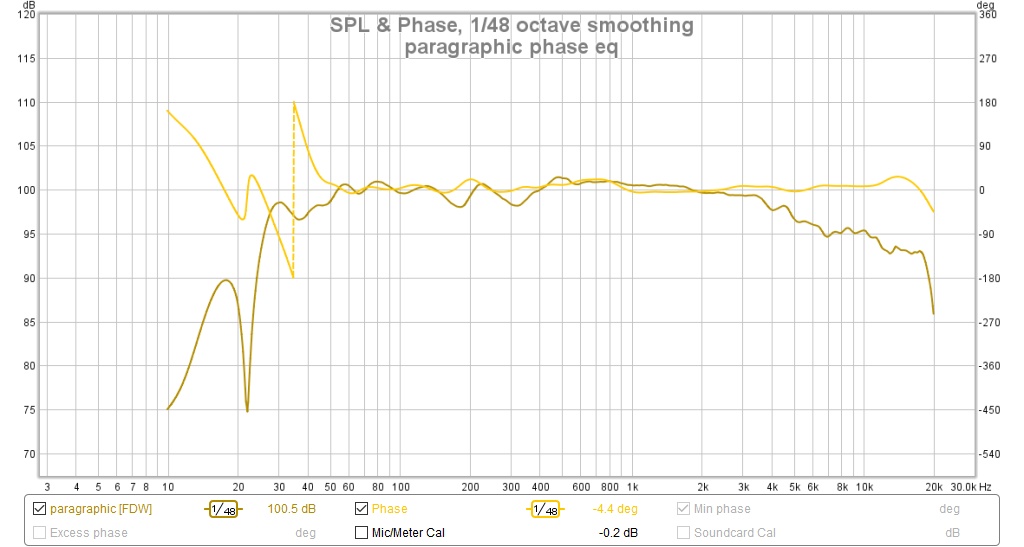
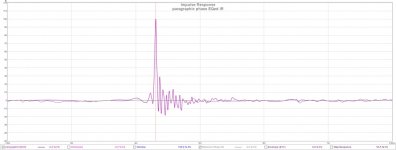
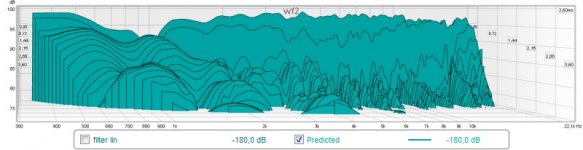
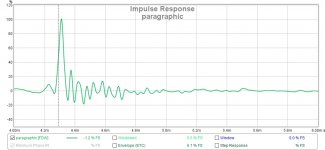
I also did a trial run using paragraphic phase eq to cover the entire spectrum
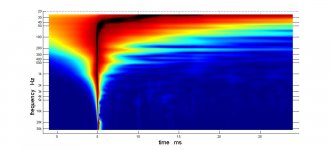
tda3d
tda pl
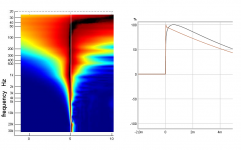
REW fr suggests I did something wrong at 22 and 35 hz
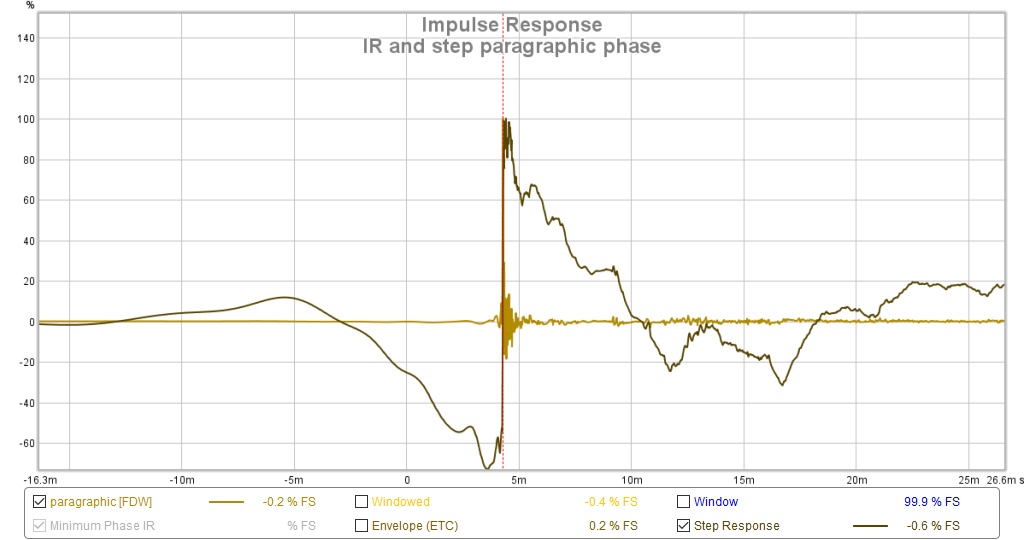
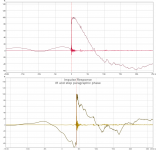
finally a step function that is somewhat presentable
There's nothing really wrong at 35 Hz, phase just passes 180 degrees there. There is a dip at 22 Hz causing the phase ripple. The strangest thing to me is no output in the TDA graph below 40Hz... it's missing and looks cut-off.
If I were in your shoes, I'd only EQ the phase to get rid of that downwards shape along the mid, right now, with your first plot you'll hear the mid before the high frequencies, that can't be good.
So only EQ phase, no FR EQ yet. Then rerun the APL_TDA. I'd only change the phase between 100 Hz and 7 KHz. Leave the rest as is. Then show a new IR and TDA plot. Once you have that 100 Hz to 7 KHz EQ-ed, compare that to the generated minimum phase from REW. That would be my goal (to begin with).
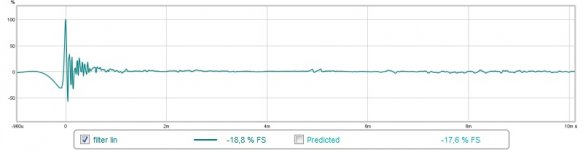
I'd like a closer view of that IR in the first 5 ms. It looks like there are some peaks there (very early reflections). They might look more severe that they truly are, so a shorter time window will show what's what. At what sample rate was this test done? 48000 or 96000? We can see some irregularities above 20 KHz in the APL plot.
Last edited:
There's nothing really wrong at 35 Hz, phase just passes 180 degrees there. There is a dip at 22 Hz causing the phase ripple. The strangest thing to me is no output in the TDA graph below 40Hz... it's missing and looks cut-off.
If I were in your shoes, I'd only EQ the phase to get rid of that downwards shape along the mid, right now, with your first plot you'll hear the mid before the high frequencies, that can't be good.
So only EQ phase, no FR EQ yet. Then rerun the APL_TDA. I'd only change the phase between 100 Hz and 7 KHz. Leave the rest as is. Then show a new IR and TDA plot. Once you have that 100 Hz to 7 KHz EQ-ed, compare that to the generated minimum phase from REW. That would be my goal (to begin with).
I'd like a closer view of that IR in the first 5 ms. It looks like there are some peaks there (very early reflections). They might look more severe that they truly are, so a shorter time window will show what's what. At what sample rate was this test done? 48000 or 96000?
If I had EQed correctly at 35 Hz, the phase wouldn't have crossed 180.
The null at 20 Hz is a rephase filter artifact, I saw it in the predicted filter response after I generated the .bin file - as if it couldn't optimize it out.
Looking at TDA with wider time limits, I see the output below 45 Hz out around 60 ms. pushed out there by a room resonance...
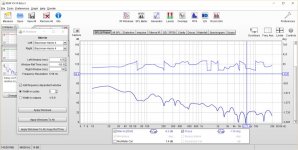
The min phase in REW is indescribable so I'll show you a picture. Phase goes from 0 at LF to 1800 degrees at that peak with 12 or 13 wraps when drawn that way.
REW is doing 48000 samples/sec. TDA is 96000
Here is the IR. I've always had an early reflection just under 1 ms and also always had what I thought was ringing in that region. (See earlier IRs)
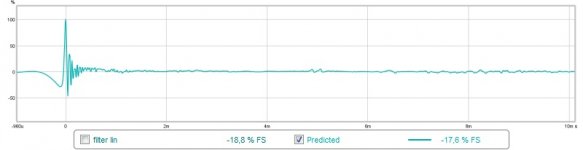
These two pictures were for the paragraphic EQ
Re' what to do next - I want to see if changing the XO points slightly will fix/affect that phase belly in the midrange. That goes hand in hand with not correcting the phase/group delay of the very low bass, as you recommend.
I wonder what the box options in the filter lin tab are. Is that a way to include and correct some or all of the bass roll off?
Attachments
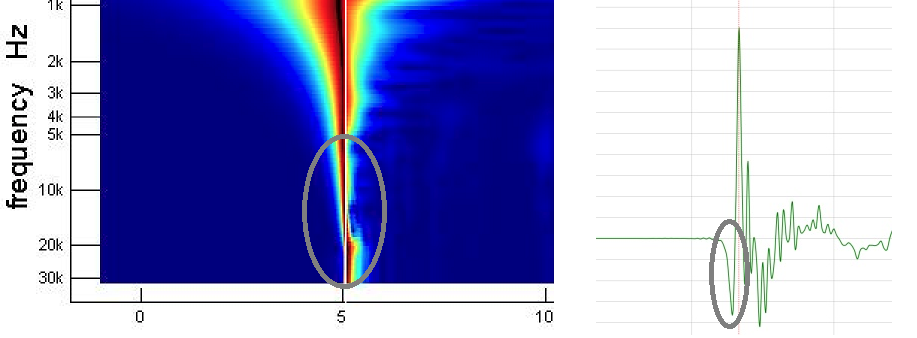
Think all the time into REW measurements compression driver had shown lag above 4-5kHz area, whether this is real performance for the CD device and can be corrected or it is measurement setup artifacts is not known, but take it into consideration it will show up as lagging phase into REW verse midrange area.
Attachments

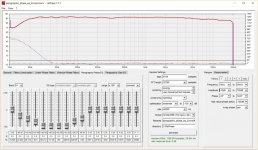
paragraphic filter artifact slain
I just went into rephase and smoothed out the phase from about 60 Hz on down. First iteration, I stopped correcting towards the low end too abruptly. Here I tapered it off.
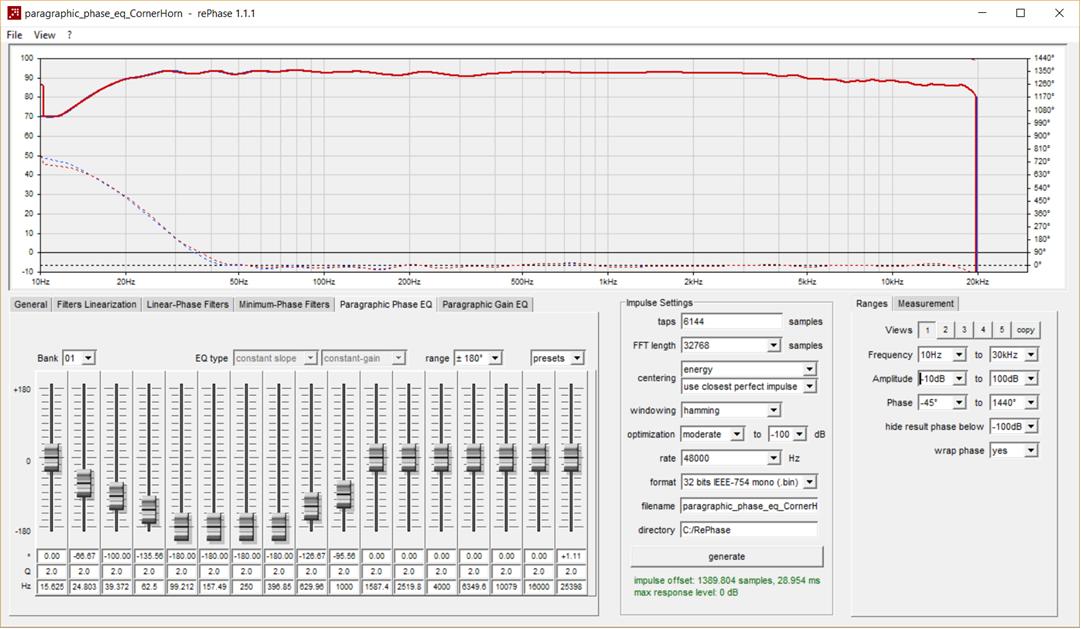
That is showing 1 filter bank but I used parts of two other banks
I just went into rephase and smoothed out the phase from about 60 Hz on down. First iteration, I stopped correcting towards the low end too abruptly. Here I tapered it off.
That is showing 1 filter bank but I used parts of two other banks
Attachments
.....I wonder what the box options in the filter lin tab are. Is that a way to include and correct some or all of the bass roll off?
All sections into that tab is to help linearize known schemes but is not locked so even the "Subsonic" section can take frq settings above 20kHz, they very flexible and meant to be for use to hit a curve one should wish for.
All sections into that tab is to help linearize known schemes but is not locked so even the "Subsonic" section can take frq settings above 20kHz, they very flexible and meant to be for use to hit a curve one should wish for.
thanks. Now I realize I don't need them. I've have an LT in the miniDSP for that. I don't want to boost any more below 30 Hz as I see distortion rising.
Think all the time into REW measurements compression driver had shown lag above 4-5kHz area, whether this is real performance for the CD device and can be corrected or it is measurement setup artifacts is not known, but take it into consideration it will show up as lagging phase into REW verse midrange area.
If one selects the right numbers in IR filtering you can actually look what frequencies come before the main pulse. From what I see this won't be high frequency material (as that's arriving late).
Something like this in IR windows:
Left Window: 100
Window Ref Time: -50
Right Window: 50
Apply that window and see in the FR tab which frequencies are firing before the initial peak.
We want to set the right hand edge of the IR window just before the first sharp rise of the IR and then look in the FR window to see what gets through the gate? The peak occurs at 4.3 ms. I set the right window to 4.0 and saw a valley at 300 Hz about 15 db down from the highs, which looked normal, and just gradually towards the low end
Not sure if that is what you are looking for but that is what I see
weasyso,
Thanks tip will remember and try it out.
nc535,
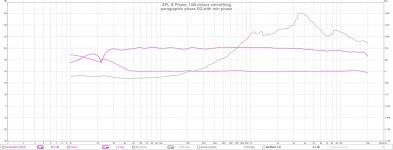
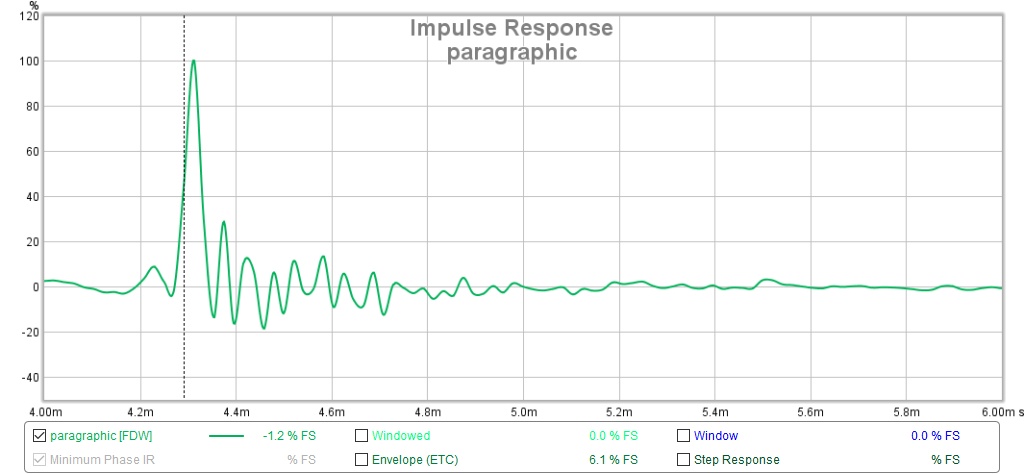
If you continue see a sharp SR peak when at same have a tonal curve with falling response up in frq think you shall try as suggested in post 404 to set tweeter with a little less delay, below is my own system verse yours and in tweeter have little less amplitude than rest of bands first attack peak shall not go up to 100% and can indicate that in yours its not tweeter that is absolut in front.
Thanks tip will remember and try it out.
nc535,
If you continue see a sharp SR peak when at same have a tonal curve with falling response up in frq think you shall try as suggested in post 404 to set tweeter with a little less delay, below is my own system verse yours and in tweeter have little less amplitude than rest of bands first attack peak shall not go up to 100% and can indicate that in yours its not tweeter that is absolut in front.
Attachments
Last edited:
We want to set the right hand edge of the IR window just before the first sharp rise of the IR and then look in the FR window to see what gets through the gate? The peak occurs at 4.3 ms. I set the right window to 4.0 and saw a valley at 300 Hz about 15 db down from the highs, which looked normal, and just gradually towards the low end
Not sure if that is what you are looking for but that is what I see
Set Window Ref Time to -50 and set Right Window to 54.3 (right at the peak, a lot can happen in 0.3 ms 🙂).
Now look at the FR chart.
Do this with a perfect Dirac pulse and you see nothing in the FR graph. So everything before the peak is in that FR graph.
You could also dissect the IR to find which frequencies do what... But the above will give you an idea what is happening.
Only do this for the plots with the crossover correction, not the one with the Paragraphic Phase EQ.
In general we are trying to optimise the crossover so it all fits.
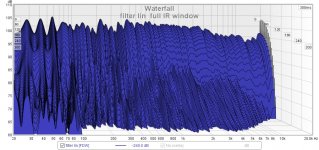
If we have that right, I wouldn't mind seeing an early waterfall plot. Kind of curious to find out what the wiggles are after the main pulse.
It's either reflection/diffraction or some ridges in this waterfall plot.
Posting the REW file that got you this plot would help: 🙂

I think BYRTT is right with the idea to slightly reduce the delay of the tweeter.
That generated phase plot is weird though. It should look a lot like the FR graph, except on top and bottom end.
What kind of filters were on for that plot? Frequency dependent window? What values?
Last edited:
Set Window Ref Time to -50 and set Right Window to 54.3 (right at the peak, a lot can happen in 0.3 ms 🙂).
Now look at the FR chart.
this is the XO filter linearization plot windowed that way

Do this with a perfect Dirac pulse and you see nothing in the FR graph. So everything before the peak is in that FR graph.
You could also dissect the IR to find which frequencies do what... But the above will give you an idea what is happening.
Only do this for the plots with the crossover correction, not the one with the Paragraphic Phase EQ.
In general we are trying to optimise the crossover so it all fits.
If we have that right, I wouldn't mind seeing an early waterfall plot. Kind of curious to find out what the wiggles are after the main pulse.
It's either reflection/diffraction or some ridges in this waterfall plot.
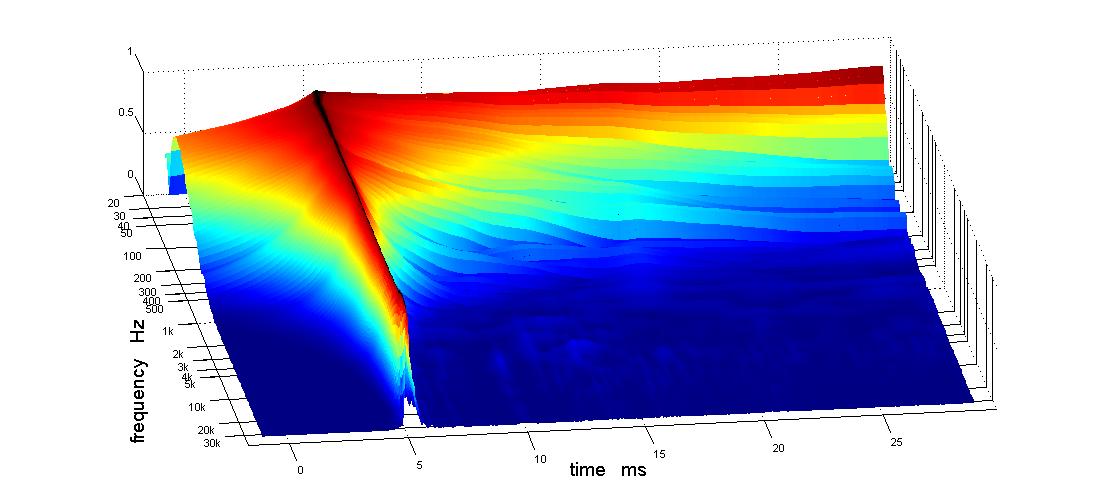
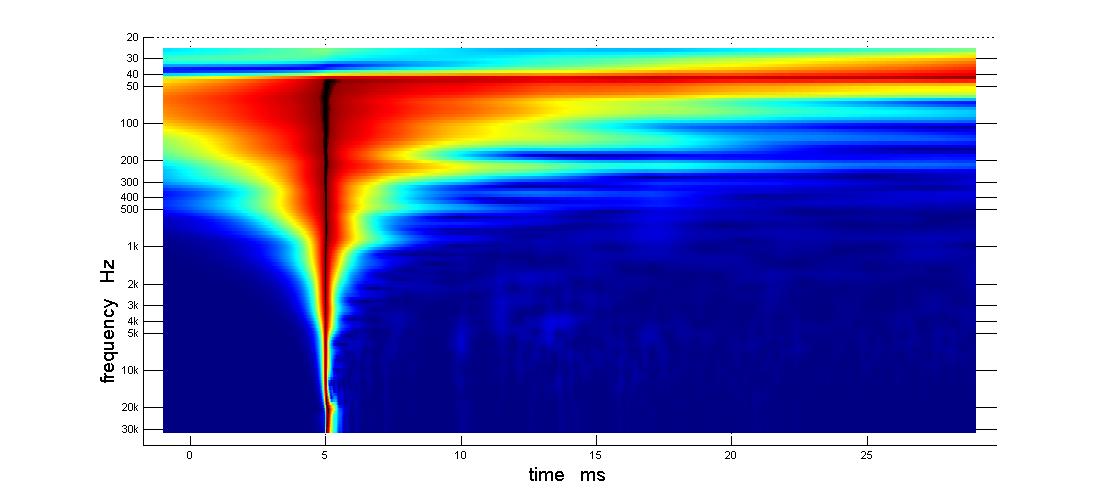
Here is the waterfall. Looks the same indep of the windowing but does have the FDW5

Posting the REW file that got you this plot would help: 🙂
I can't read the tea leaves like you so I tried to give you the REW.mdat. It was too large so I attached the REW.wav zipped
What kind of filters were on for that plot? Frequency dependent window? What values?
by default window is 5 cycle FDW for all these measurements, no other smoothing
Now look at the FR chart.
this is the XO filter linearization plot windowed that way
Do this with a perfect Dirac pulse and you see nothing in the FR graph. So everything before the peak is in that FR graph.
You could also dissect the IR to find which frequencies do what... But the above will give you an idea what is happening.
Only do this for the plots with the crossover correction, not the one with the Paragraphic Phase EQ.
In general we are trying to optimise the crossover so it all fits.
If we have that right, I wouldn't mind seeing an early waterfall plot. Kind of curious to find out what the wiggles are after the main pulse.
It's either reflection/diffraction or some ridges in this waterfall plot.
Here is the waterfall. Looks the same indep of the windowing but does have the FDW5
Posting the REW file that got you this plot would help: 🙂
I can't read the tea leaves like you so I tried to give you the REW.mdat. It was too large so I attached the REW.wav zipped
What kind of filters were on for that plot? Frequency dependent window? What values?
by default window is 5 cycle FDW for all these measurements, no other smoothing
Attachments
Think all the time into REW measurements compression driver had shown lag above 4-5kHz area, whether this is real performance for the CD device and can be corrected or it is measurement setup artifacts is not known, but take it into consideration it will show up as lagging phase into REW verse midrange area.
A note to that IR at right is it is actually HP filtered IIR LR8 HP tweeter alone and not the system IR, and also before any FIR filtering was added, such preringing can indicate response lagging the higher the frq of that passband and could be some inherent mechanical solution into CD that is the cause.
It looks like the bend in the direct response of the TDA graph is up in the breakup region of the CD's diaphragm. In the FR, there is a peak at/about 18 Khz and then the response drops quickly
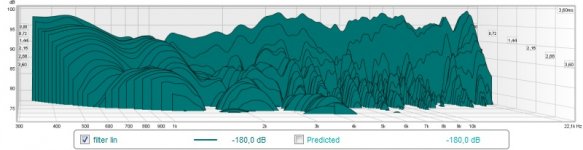
What I wanted to see is if the ringing in the impulse was showing in the waterfall plot. It was...
Here's the early waterfall plot:

And after some EQ:

I stopped where the tweeter hands over to the mid. I still think there's some possible gain left in that crossover.
What does that do for the ringing in the impulse?
Before:

After:

Now before we can conclude this can be EQ-ed away, we'd have to do some polar measurements to see if this holds up over a wider angle.
It could be the midrange taps that cause the rough response.
Here's the early waterfall plot:
And after some EQ:
I stopped where the tweeter hands over to the mid. I still think there's some possible gain left in that crossover.
What does that do for the ringing in the impulse?
Before:
After:
Now before we can conclude this can be EQ-ed away, we'd have to do some polar measurements to see if this holds up over a wider angle.
It could be the midrange taps that cause the rough response.
Attachments
Last edited:
Instructive. This reminds me that the IR tells the entire story but also that I don't know how to read it in the IR.
I'll note in passing that the paragraphic phase EQ IR has less ringing, supporting the hypothesis that at least some of the ringing can be EQed away
But if that is ALL ringing, then where are the expected early floor reflections? I did throw some padding on the floor for this measurement but I didn't think it would suppress the floor completely.
Now I can see what you mean by early waterfall. I set the waterfall time range to 3.6 ms but got a totally different picture viewed from a different angle. you must have different windowing than I was using and different waterfall controls, except the IR windows don't seem to affect the waterfall. Can you tell me the rew settings for reproducing these early waterfalls?
Attachments
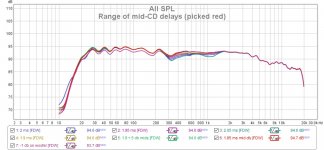
Before I take another look at the mid-CD delay timing, I want to share this picture that shows how I arrived at 1.85 ms. I took measurements over a range of delays and picked the one that gave me the flattest response through the crossover region.
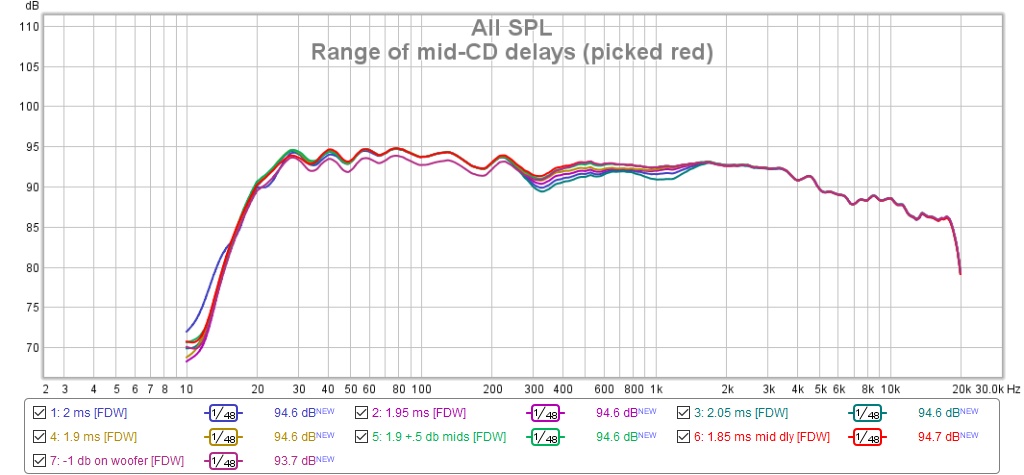
My thinking was that since I had EQed to the target response than the flattest response would occur when the two drivers were in phase. I completely ignored phase tracking, just looked at the magnitude curve, so timing could be off.
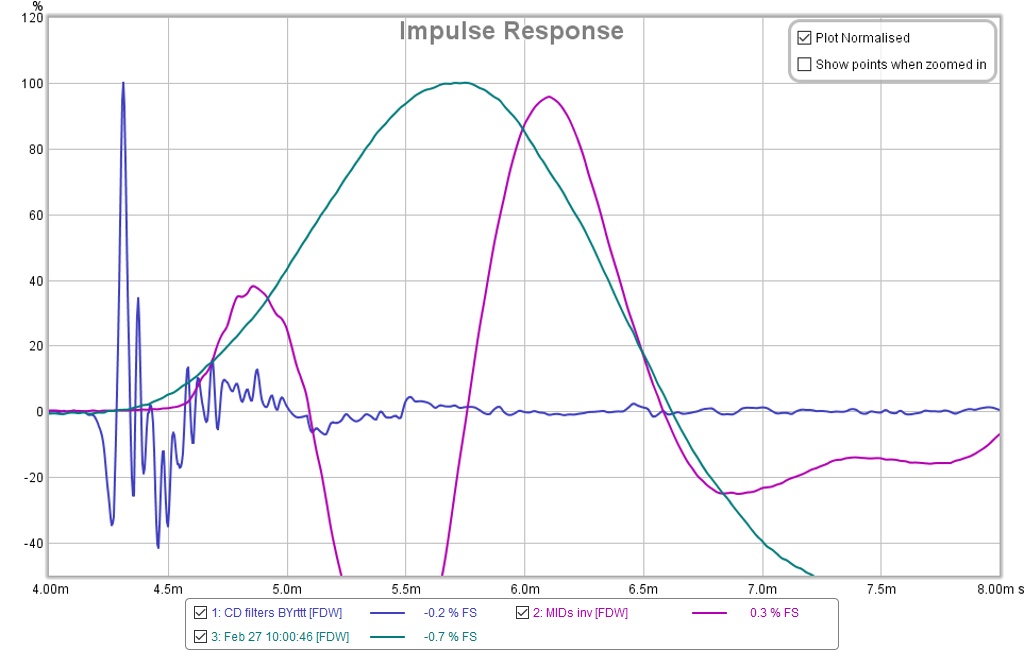
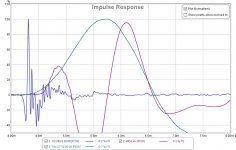
So if I'm going to adjust the DSP delay, what should be my criteria for deciding what to change it to? Should I simple look at the individual driver IRs in Overlay and get the starts lined up?
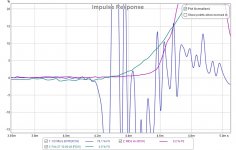
magnified
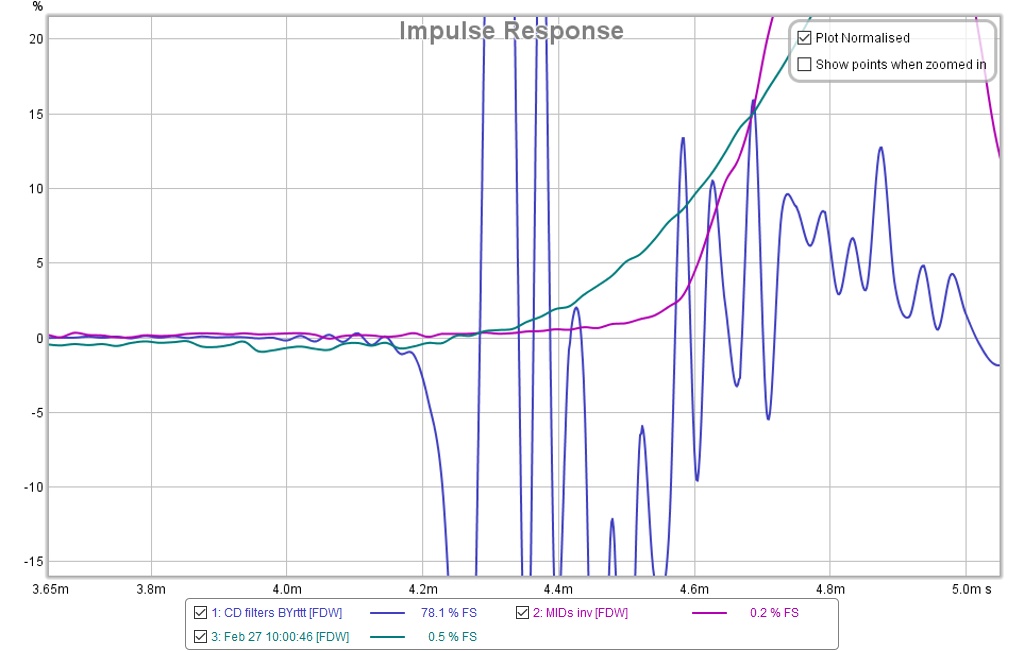
Where would you call the start of the mid response? It looks to me that I have it 0.1 ms late; start of mid aligned with first rise of CD
My thinking was that since I had EQed to the target response than the flattest response would occur when the two drivers were in phase. I completely ignored phase tracking, just looked at the magnitude curve, so timing could be off.
So if I'm going to adjust the DSP delay, what should be my criteria for deciding what to change it to? Should I simple look at the individual driver IRs in Overlay and get the starts lined up?
magnified
Where would you call the start of the mid response? It looks to me that I have it 0.1 ms late; start of mid aligned with first rise of CD
Attachments
- Home
- Loudspeakers
- Multi-Way
- My Synergy Corner Horn and Bass Bins