They didn't follow the Radiohead advice: "No alarms, and no surprises, please".
Which also means if you're gunning for an answer, you can probably find it hook or crook.
There was a blinking red light in the control room that NEVER went on before which indicated that safeties were inactive so no one paid any attention, shades of Andromeda Strain. It really is amazing this stupid stuff actually happens, though in this case it isn't that big a deal and as they say, "it won't happen again".
I would probably be very disappointed in the results of a DBT where certain people were told that the only difference in the files was, in one case they were recorded with and without proper dither and in the second case they passed through a $5000 interconnect vs. a $5 one.
If you really look at that JBL horn you will notice that there is in fact diffraction used in the initial opening of the horn.
That brings up a question I've had (probably should ask Geddes, but he's not been hanging around this forum recently). When do small discontinuities become "diffraction"? For example, in every compression driver phase plug I know of, air gets squished between the diaphragm and a very noncontinuous surface (with irregular holes in it even!), is that diffraction too? They certainly do something to the pressure front (otherwise, why have them?). How about the tiny grain in the surface of the horn, or edges in the driver throat? I've never seen a difference in response (at least) from polishing the walls of a horn (and yes, I've tried it). Or the edge of the diaphragm itself, that's one BIG discontinuity (it's not an expanding/compressing sphere after all)?
My assumption would be that it depends on the size of the irregularity compared to the size of the wavelength in question. The gaps and openings in the phase plug are way smaller than any in-band wavelengths so they don't meet that standard for diffraction (by my assumption, above).
How big are the little nerdlies that stick out in the throat of the M2 horn? Compared to a 20kHz wavelength?
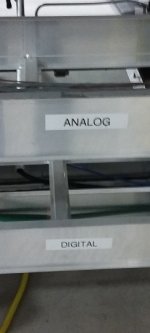
I recall an account of a friend who visited Drever's lab ages ago and noticed that there were piles of sort-of gummy animals used as vibration isolation parts. They couldn't find the particular material in any more convenient form from outfits like Lord etc. so they bought a lot of the toys.These guys have a sense of humor, BTW there is only one digital line. These are 12" wide catwalks with wires laid along them.
I agree I much prefer the older discrete waterfall type of plots where you can see trends and high Q peaks in the decay. These color plots seem to be the new age graphing representation but leave much to be desired in resolution.
If I understand your statement correctly, those two types of plots aren't indicating the same kinds of things. Notice that the color polar plots have dimensions of angle, intensity, and frequency. While the decay waterfall plots are dimensions of time, intensity, and frequency (I think you are referring to the Cumulative Spectral Decay plots originally devised by Laurie Fincham?).
I've programmed four measurement systems now which provide display of the CSD, because people ask for them. But I've never really thought they were very relevant. Changing parameters of the CSD display (any of the three dimensions, the angle the 3D structure is viewed from, where the lines fall, where the top of the curve is placed, and particularly the intensity value at the "floor" of the graph) can wildly change the subjective appearance of the plot, easy to make it look good or bad. Custom made for marketing or promotion abuse.
Add to that the recent research from Toole and company about the relative audibility of narrow high-Q resonances. The CSD plot is particularly good for highlighting things that seem to not be very audible.
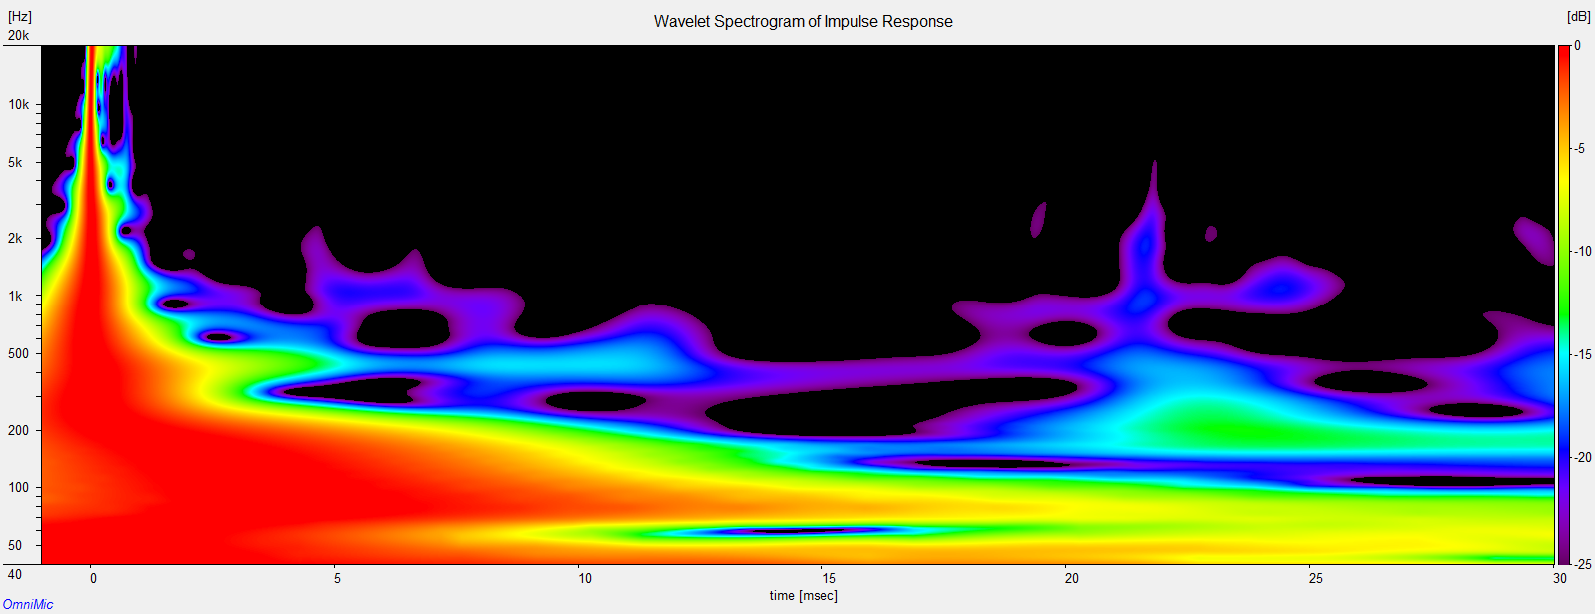
The Wavelet Spectrogram plots are a more recent time/intensity/frequency display, in color, which MIGHT be more relevant. I am wary, though, that it might also be subject to human interpretation error (like oscilloscope waveforms, or CSD plots, or maybe even Step Responses or frequency responses) that make us always tend to think that something that is more easily seen with eyes will also be similarly audible.
Last edited:
Doc Geddes visited the forum Sunday.That brings up a question I've had (probably should ask Geddes, but he's not been hanging around this forum recently). When do small discontinuities become "diffraction"?
I would like to see the software that supposedly is being used to design any horn or waveguide that is based on designing using anything but plannar wavefronts.
The JMLC design is based on a spherical section wavefront. It can be done geometrically, using Huygens' construction, or calculated using iterative (step-by-step) method.
One purpose of the "tangerine" in compression drivers is to force a flat wavefront at the throat, so an ideal horn wavefront has a flat center circle the size of the throat and a spherical "donut" surrounding it. Real wavefronts in the horn take their shape from the constancy of the speed of sound. Same outside the horn in free air of course.
All good fortune,
Chris
It is interesting how two graphic presentations of the same information can be so different that for me I'm have some difficulty visualizing the data in a familiar way.
Hi Demian
The two sonograms (horiz-vert directivity) are not identical and they seem very good to me. What is not specified is the measuring distance and the 0dB reference
See attachment (Help section of ARTA SW) for an intuitive transition from the familiar waterfall to the somehow newer (old news in ultrasonics) sonogram
And I envy you for your day job
That's loud enough to be not too useful.
The loudspeaker is for pro use.
Your ear (and air itself) are nonlinear at those levels.
Air nonlinearity vs SPL:
I had a look at classical Thuras paper.
https://archive.org/details/bstj14-1-159
Fig 1a shows start of discerning nonlinearity at 0.1BarG. This is 10kPa, translating to 174dB SPL.
Even more linear at 0.05BarG=5kPa=168dB SPL
Fig 3 is at 1993 Bar=199.3MPa=260dB SPL
Fig 4 is at 220Bar=22Mpa=241dB SPL
Fig 5 is at 600 Bar=60Mpa=250dB SPL
Fig 6 (summation) is at 2375Bar=237.5Mpa=262dB SPL
Fig 6 (difference) is at 2280Bar =228Mpa=261dB SPL
On the other hand, cochlear distortion starts a sharp rise at 90-100dB SPL 😀
(say that to the pros)
George
Attachments

That brings up a question I've had (probably should ask Geddes, but he's not been hanging around this forum recently). When do small discontinuities become "diffraction"? For example, in every compression driver phase plug I know of, air gets squished between the diaphragm and a very noncontinuous surface (with irregular holes in it even!), is that diffraction too?
Diffraction occurs when a discontinuity results in the creation of an independent new wave front. This new wave front interacts with the original wave front, resulting in a pattern of reinforcement or diminution, as well as having effects on directivity.
In a compression phase plug, a different mechanism is at work (btw, in the horn throat, the wave front is constrained by dimensions too small for interference by diffraction to occur). The whole purpose of the phase plug is to ensure that the acoustic waves coming from different points of the driver diaphragm arrive coincidentally at the horn throat. It is an anti-diffraction device.
I'd love to see a plot somewhere that shows the impact on the audio band response, distortion etc of a power amplifier that has a CM ferrite clamped to its mains power cable. If Bybee QP's can miraculously improve sound, I am quite sure ferrites do a great job of converting HF electrical noise into heat energy and thus cleaning things up. So how the hell does this affect thing negatively in the audio band? On the one hand we have a highly questionable product and on the other a proven engineering solution (plots, measurements, solid EM theory basis etc) used in thousands of mission critical applications.
Alternatively, in the absence of plots etc, a DBT with statistically significant result would also swing me.
However, like the maple cable lifters I am not expecting much other than conjecture and peeking.
(CH = Charles Hansen aka the 'sandman' who got the moniker because John Atkinson printed a Natsemi inspired press release of the then new LM4562 in which it claimed to have superior sound and specifications for audio. CH didn't like it - discretes and in particular JFET's were the way to go and he took umbrage with JA, calling opamps 'bits of 'dirty sand' or words to that effect).
[no hard feelings Destroyer - I just can't help taking a dig at claims that have no engineering or DBT evidence. Separately, your CM and DM chokes probably do a good job. I'm more drawn to the cable lifters and ferrites are bad claims 🙂 ]
Last edited:
Bonsai is a on the good side, saying he is trying to be an ******* is a little over the top.

I'd love to see a plot somewhere that shows the impact on the audio band response, distortion etc of a power amplifier that has a CM ferrite clamped to its mains power cable. If Bybee QP's can miraculously improve sound, I am quite sure ferrites do a great job of converting HF electrical noise into heat energy and thus cleaning things up. So how the hell does this affect thing negatively in the audio band? On the one hand we have a highly questionable product and on the other a proven engineering solution (plots, measurements, solid EM theory basis etc) used in thousands of mission critical applications.
Alternatively, in the absence of plots etc, a DBT with statistically significant result would also swing me.
However, like the maple cable lifters I am not expecting much other than conjecture and peeking.
(CH = Charles Hansen aka the 'sandman' who got the moniker because John Atkinson printed a Natsemi inspired press release of the then new LM4562 in which it claimed to have superior sound and specifications for audio. CH didn't like it - discretes and in particular JFET's were the way to go and he took umbrage with JA, calling opamps 'bits of 'dirty sand' or words to that effect).
[no hard feelings Destroyer - I just can't help taking a dig at claims that have no engineering or DBT evidence. Separately, your CM and DM chokes probably do a good job. I'm more drawn to the cable lifters and ferrites are bad claims 🙂 ]
I won't pretend to tell you I know why clamp on ferrite beads never work out right. Along with another guy we tried them in all different areas of an amplifier I made for him. He even started cutting them into different sizes. No matter where or what size, whatever sound benefit came, came at the price of some other attribute plummeting. So now I simply don't bother with them since I can get results I want with CM and DM chokes.
But CM and DM chokes have their own woes, since they often cause resonances that have to be taken care of or you lose a lot of power. The differences is I know what's happening and can deal with it.
You know you can do your own experiments with claims, right? I've tried a few things that seemed to not make any real sense, and most don't work. But I've found one gem in particular.
The M2 dynamic range continues to be impressive compared to the ESL and other typical systems using all dynamic drivers. It adds a dimension of realism to the sound. I do not think the perceived dynamic range extension has been an added effect to the source material.
The idea of constant directivity for a flat power response has always worked for my listening environments. But, it has to be combined with a narrow enough dispersion... less than 90 degrees total. I also found, years ago, that 60 degrees was ideal... 45 too narrow. The M2 also uses 60 degrees and constant directivity.
Here is the raw data of averaged SPL at the listening position for the room + speaker (using pink noise) you can see some room gain affecting the bass rise on the left speaker due to its proxy to a corner environment. Spkr-room will go flat down to 30Hz -- without any EQ. Over-all, it is very good result IMO. One always wants to have best results as possible before EQ. Next is to fine tune/EQ it.

Isn't this what High-End is about? The best source, amps and speaker-room setups with best interfacing and clean ac power? A lot of it can be DIY.
THx-RNMarsh
The idea of constant directivity for a flat power response has always worked for my listening environments. But, it has to be combined with a narrow enough dispersion... less than 90 degrees total. I also found, years ago, that 60 degrees was ideal... 45 too narrow. The M2 also uses 60 degrees and constant directivity.
Here is the raw data of averaged SPL at the listening position for the room + speaker (using pink noise) you can see some room gain affecting the bass rise on the left speaker due to its proxy to a corner environment. Spkr-room will go flat down to 30Hz -- without any EQ. Over-all, it is very good result IMO. One always wants to have best results as possible before EQ. Next is to fine tune/EQ it.
Isn't this what High-End is about? The best source, amps and speaker-room setups with best interfacing and clean ac power? A lot of it can be DIY.
THx-RNMarsh
Last edited:
You can do it all DIY... Just don't expect it to be free... or be as simple as bringing it home and plugging it in. If you or JC, whomever, spend years crafting things, then the DIYer might expect to have to put some time in before its at a "sellable" level.
Your speaker response is pretty damn good. I wonder if the midbass hump is intentional in the speakers? That's a common thing. And don't expect sound to improve with EQ necessarily.
Your speaker response is pretty damn good. I wonder if the midbass hump is intentional in the speakers? That's a common thing. And don't expect sound to improve with EQ necessarily.
Last edited:
What body part goes in the hole?
Take your prick, er, I mean pick. 😛
se
- Status
- Not open for further replies.
- Home
- Member Areas
- The Lounge
- John Curl's Blowtorch preamplifier part II