I still can't believe that you are not doing this deliberately. Let's look at the table for 2HD 3HD and 5HD and convert percentage into db.
2HD = 0.0849% = -61.4db. Chart confirms.
3HD = 0.0399%= -68.0 db. Chart says -56 db. Not even close.
5HD = 0.0122%= -78.3 db. Chart says -57 db!
Do you see? Your software or use of it has a problem. Now please stop being so obtuse and ultra defensive. My first post was quite clear.
I contacted the author of REW (who has done an enormous favor for the DIY community with his contributed software) and asked him about how the displayed THD and Hn components are calculated. He said that the individual harmonic contributions are calculated relative to the fundamental power. There is a fine point though, you can't pull the peak value - because there is a spread of power over finite number of frequency bins due to the window function (Hanning, etc) on the FFT. The software integrates the power over the appropriate bins and divides by the amount the window function spreads the signals (the so-called noise equivalent bandwidth) before taking the square root of the ratio of the power for the harmonic component in question relative to the fundamental power, and then displayed in percent. So basically, there will be minor discrepancies when you try to pull peak values off the graph and compare to displayed number especially for smaller components relative to fundamental. I hope that helps to clarify what we are seeing.
OK so please show the calculation, even roughly, that yields 0.0122% or -78.3 dB when your chart its showing -57 dB. 'Minor'?
xrk don't let your pundits get you upset it only serves their purposes...
^ That's a pretty ridiculous insult. There's something clearly odd about how the tabular form of harmonics is being reported and some of us are trying to get to the bottom of it. No agenda to cut anyone down, but rather figure out what's up.
XRK--thanks for the info. It looks like that calc works for the 2nd order, but falls apart with 3rd and higher. Simply does not even pass the smell test as tnargs has been listing. There is simply something wrong with the algorithm or the implementation thereof. I don't want to take anything away from the software developer--simply, if anything, a desire to make REW better.
Last edited:
^ That's a pretty ridiculous insult. There's something clearly odd about how the tabular form of harmonics is being reported and some of us are trying to get to the bottom of it. No agenda to cut anyone down, but rather figure out what's up.
XRK--thanks for the info. It looks like that calc works for the 2nd order, but falls apart with 3rd and higher. Simply does not even pass the smell test as tnargs has been listing. There is simply something wrong with the algorithm or the implementation thereof. I don't want to take anything away from the software developer--simply, if anything, a desire to make REW better.
When the settings for RTA are in the "coarse" mode (1/12th oct, 50% overlap, etc.) the bins for the spectrum are wide and there is spectral content that is not captured with the peak height. So, one would have to go back in an bin-by-bin, pull off several peak values, and then normalize by effective bandwidth. You need to actually have the RTA window still "alive" to do this. The plot in question by Tnargs was taken long ago so can't do that, plus it is a pain. However, if one adjusts the RTA settings so that the display is "Fine" (spectrum mode - no octave avg, 87.5% overlap, exponential averaging 0.94, and Blackman-Harris 7 window), the RTA plot is a stick plot where the peak is about the same as the total bin value. So I went back and collected an RTA from the 10F/8424 Trynergy tractrix horn that is currently setup and I pulled off the peak values and put them in a spreadsheet to compare with the displayed values. Also, it helps to switch the vertical scale to dB FS (rather dB SPL) because we are dealing with signal when doing the calcs.
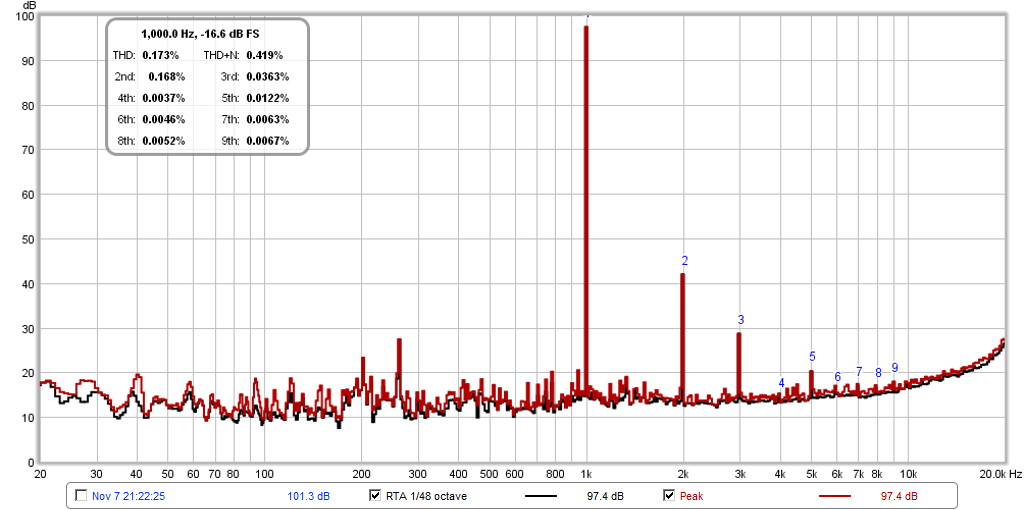
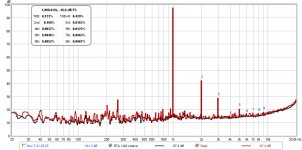
So here is the RTA spectrum as it would appear with 1/48th oct avg in dB SPL:
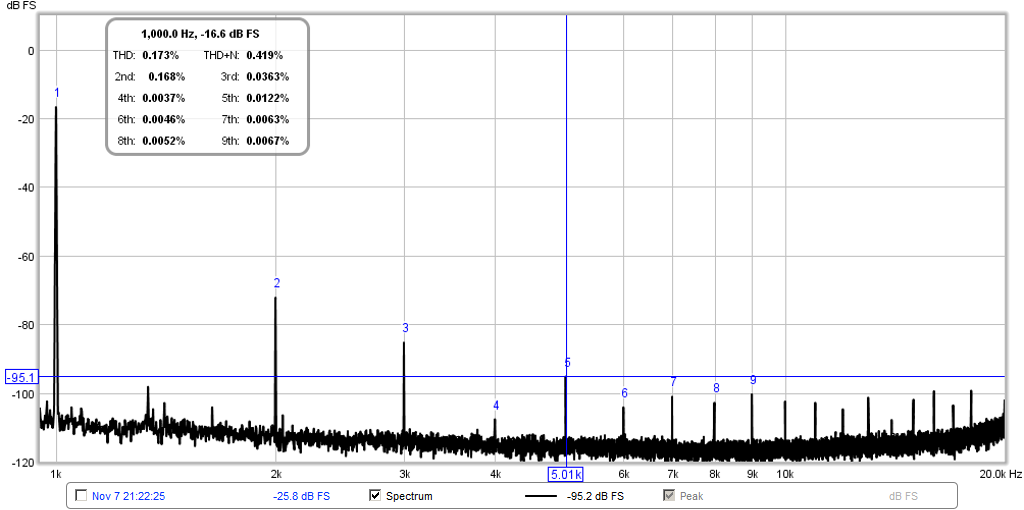
Here is the same RTA but in spectrum mode (no oct avg.) and db FS and zoomed in to widen the resolution in freq space so I could accurately place the cursor (shown at H5):
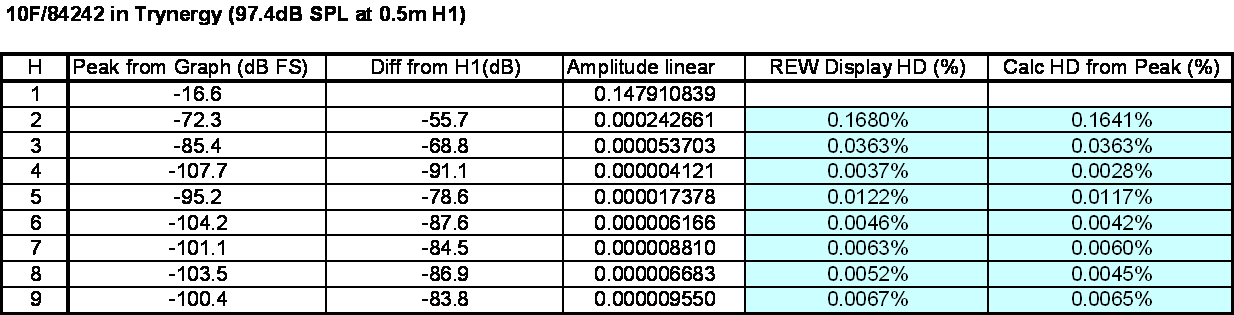
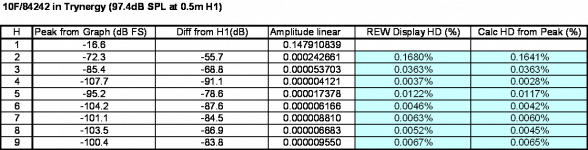
Here is a table I made from the peak values and compared the calculated HD with the displayed HD. The individual harmonic contributions are calculated simply by first converting the db FS to a linear number then taking the ratio of the Hn/H1 in percent. As you can see, the displayed HD values are very close to the calculated ones. I think John Mulcahy's algortihm/equations for calculating HD are correct (and in fact he double checks the software using a known source of HD generator and comparing with the measured result). It's when you have wide bins due to default settings, the values are obscured by residual power in adjacent bins which have to be accounted for when double checking the display vs graph values visually. For H5, for example, I calculated 0.0117% and REW's RTA displayed 0.0122%:
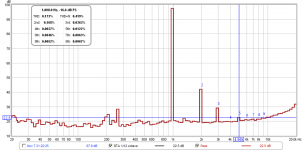
I know there will still be disbelievers out there, so here is the same data but shown in coarse 1/12oct mode typical of the default settings I used before:
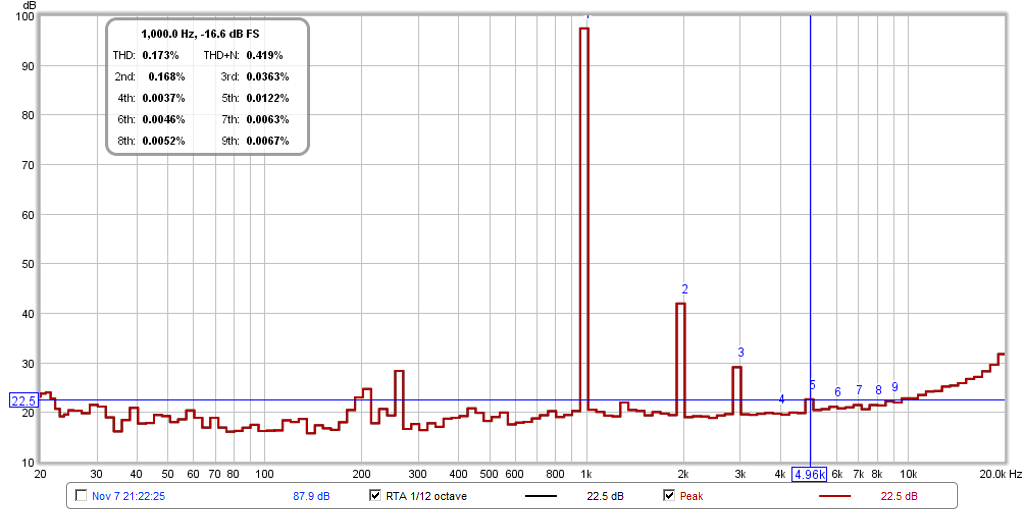
Pulling off the H5 peak value here is 22.5dB and the H1 is 97.4dB and the same calculation of H5 now yields 0.018% disortion, a larger value than displayed by REW.
I hope this helps to settle all the questions around whether or not REW is calculating the HD components correctly.
Attachments

Last edited:
It does, to what I can tell. Thanks. Moral of the story is the importance of paying attention to the binning and end-to-end data management. Otherwise you get plots that don't make any sense. 🙂
Ok, so now we can get back to talking about how CLD can knock down HD in a horn and give some very nice low distortion numbers. The 10F/8424 tractrix, according to the above data is producing 0.168% H2 and 0.0363% H3 at equivalent 91.4dB at 1 meter with THD of 0.173%.
Feed Tubs like this have a thick, dead rubber which apparently goats can't chew.
via Tapatalk
Its been a while since the goats ate any of my speakers!😉
It is on my todo list to do some calculations w.r.t. stiffness vs damping for the first few modes of a representative cabinet or two. I have not found much on the web but suspect it is the type of knowledge a speaker company would tend to keep to itself apart from a few diagrams and hand waving in the marketing.
I have not found out about suitable glues but you will be looking for a good bond in order to maximise the strain in the damping layer. There are plenty of commercial examples about and so I would not expect it to be a significant issue.
Its easy enough to calculate the resonances of a panel, but what about a box with connected corners!? From automotive, it turns out that the details of the corner stiffness is a dominate factor - and very hard to predict. So calculating the enclosure resonances is a highly non-trivial task. Even with FEA, which the car companies have always had, it was the joint stiffness that dictated and was highly variable and hard to model.
Ok, so now we can get back to talking about how CLD can knock down HD in a horn and give some very nice low distortion numbers.
The point that I have made from the beginning is that the horn design cannot lower THD. Your data never looked right and that's what started this whole thing. But now you seem to be back on the idea that the horn can somehow magically linearize the signal from a nonlinear driver.
You might ask, how low is the THD on some other horns? To which I would simply reply: "I don't know and I don't care since I proved some time ago that THD in a compression driver is not audible." And since the horn cannot lower something "not audible" to "less than not audible", I simply don't care what the number are - they don't matter.
You might ask, how low is the THD on some other horns? To which I would simply reply: "I don't know and I don't care since I proved some time ago that THD in a compression driver is not audible." And since the horn cannot lower something "not audible" to "less than not audible", I simply don't care what the number are - they don't matter.
With a 100 watts into a compression driver I don't think think you performed a listening test you performed torture.
The point that I have made from the beginning is that the horn design cannot lower THD. Your data never looked right and that's what started this whole thing. But now you seem to be back on the idea that the horn can somehow magically linearize the signal from a nonlinear driver.
You might ask, how low is the THD on some other horns? To which I would simply reply: "I don't know and I don't care since I proved some time ago that THD in a compression driver is not audible." And since the horn cannot lower something "not audible" to "less than not audible", I simply don't care what the number are - they don't matter.
This is not a Compression driver and I am not talking about THD. We are looking at individual components of harmonics. Despite your "proof that THD" doesn't matter - many here would disagree and manufacturers would disagree. Why would we continue to design low distortion speakers of it did not matter? Are you saying 100% THD is not audible? 10%? I think below 1% it is tougher to tell so really what's the difference between 0.1% and 0.02% probably not audible at 92dB. But take that same system up to 120dB and it would matter. The lower the HD is at a reference level, the more headroom you have for taking it louder.
Measurements of the HD of the 10F in a sealed tapered TL yielded about -45dB HD figures. A non horn loaded driver requires almost a watt of power and the cone movement is almost a mm. Take the same driver and horn load it so that it only has to move 40microns to achieve the same SPL and it's not hard to see why HD is low. It is essentially proportional to cone movement. So reduce cone movement by 100x for same SPL and HD will drop. That's basically it in a nutshell. The CLD stopped the thin lightweight foam core from flapping around. I'm not sure why you don't agree that reducing panel vibrations reduces HD. It's not reducing intrinsic HD in the driver - it's reducing generated distortions from sympathetic vibrations.
I am also not the only one seeing low HD in a tractrix horn with a cone driver:
http://www.diyaudio.com/forums/multi-way/276721-best-cabinet-material-39.html#post4509774
Last edited:
I use numerical simulation and have no noticeable issues with cabinet corners beyond resolving the strain. Modelling damping sufficiently accurately and efficiently however is more of a problem. For the task on my todo list I will be looking largely at parametric changes rather than absolute values which eases things somewhat.Its easy enough to calculate the resonances of a panel, but what about a box with connected corners!? From automotive, it turns out that the details of the corner stiffness is a dominate factor - and very hard to predict. So calculating the enclosure resonances is a highly non-trivial task. Even with FEA, which the car companies have always had, it was the joint stiffness that dictated and was highly variable and hard to model.
What are you talking about?? More made-up claims!!
No one listened on this test at levels above 90 dB, because it was done at a university and OSHA requirements have to be met. The drivers were at 100 watts at the extreme, but that's not outside of reason.
No one listened on this test at levels above 90 dB, because it was done at a university and OSHA requirements have to be met. The drivers were at 100 watts at the extreme, but that's not outside of reason.
This is not a Compression driver and I am not talking about THD. We are looking at individual components of harmonics. Despite your "proof that THD" doesn't matter - many here would disagree and manufacturers would disagree. Why would we continue to design low distortion speakers of it did not matter? Are you saying 100% THD is not audible? 10%? I think below 1% it is tougher to tell so really what's the difference between 0.1% and 0.02% probably not audible at 92dB. But take that same system up to 120dB and it would matter. The lower the HD is at a reference level, the more headroom you have for taking it louder.
Measurements of the HD of the 10F in a sealed tapered TL yielded about -45dB HD figures. A non horn loaded driver requires almost a watt of power and the cone movement is almost a mm. Take the same driver and horn load it so that it only has to move 40microns to achieve the same SPL and it's not hard to see why HD is low. It is essentially proportional to cone movement. So reduce cone movement by 100x for same SPL and HD will drop. That's basically it in a nutshell. The CLD stopped the thin lightweight foam core from flapping around. I'm not sure why you don't agree that reducing panel vibrations reduces HD. It's not reducing intrinsic HD in the driver - it's reducing generated distortions from sympathetic vibrations.
I am also not the only one seeing low HD in a tractrix horn with a cone driver:
http://www.diyaudio.com/forums/multi-way/276721-best-cabinet-material-39.html#post4509774
OK, so your argument is "I don't care what the facts say! I know what I believe!"
Believe what you want, but there is no point in my continuing as long as you don't know the realities - no matter what you think or "manufacturers" think. PS. JBL believes what I believe so there is one manufacturer who is on my side. A not insignificant partner.
I use numerical simulation and have no noticeable issues with cabinet corners beyond resolving the strain. Modelling damping sufficiently accurately and efficiently however is more of a problem. For the task on my todo list I will be looking largely at parametric changes rather than absolute values which eases things somewhat.
Are you talking about interior resonances or cabinet structural resonances? I am talking about structural, and the edges make a lot of difference. What numerical methods do you use and what are the boundary conditions at the edges?
OK, so your argument is "I don't care what the facts say! I know what I believe!"
Where did I say that? I am the one presenting data and you are the one that just said
"I don't know and I don't care since I proved some time ago..."

What happened to the best cabinet material part of this thread?
I'm not going back to delete but anymore OT gets eliminated. Fair enough?
I'm sorry if I am not spot on here, but hopefully I get my point across.
I think we ought to be able to have a better argument here. A clear thesis has been made by xrk. HD in cone drivers can be reduced substantially by limiting cone excursion via horn loading. It can be also affected by vibrations and resonances in the structure of the horn. And he backed this up with measurements.
Geddes it seems your argument simply put is that this is just plain false. Please substantiate this with some evidence, or references to evidence.
It seems to me we can have a better argument.
Edit, oops didn't see what Cal had posted. I guess this argument ought to have it's own thread.
Last edited:
How could one examine the structural vs damping tradeoffs of constrained layer damping for the first few modes in a representative speaker cabinet or two from the interior resonances? I am talking about simulating the motion of the cabinet.Are you talking about interior resonances or cabinet structural resonances? I am talking about structural, and the edges make a lot of difference.
I use a mixture of finite element, boundary element, finite volume and finite difference depending on what is being simulated. The BCs can vary depending on what is being calculated but for a typical cabinet the external force over the surfaces in contact with the air is assumed to be zero, over the base is assumed to be the reaction to the weight of the cabinet. For forced simple harmonic motion simulations, the pressure difference from atmospheric on the inner surface could be an approximation based on distance from the driver, the driver deflection and the cabinet volume or assumed to be constant or zero given that what is to be examined is not particularly influenced by this. If it was then the air could be included in the simulations along with cabinet.What numerical methods do you use and what are the boundary conditions at the edges?
What happened to the best cabinet material part of this thread?
I'm not going back to delete but anymore OT gets eliminated. Fair enough?
Is it okay to talk about the material and damping of horn walls? To horn builders it is just a particular subgroup of cabinet, i.e. surface or containing wall.
- Home
- Loudspeakers
- Multi-Way
- The best cabinet material !!!!