It's funny you should ask! Yesterday I got a third waveguide printed, now full size: 210x130x85 mm.How are things progressing?

Here it's seen mounted on my friends D2604/830002 that I've also measured and the waveguide from earlier (162x100x60 mm).

The print quality is worst so far as there is some obvious delamination on the inside, probably due to a too low printing temperature. It did also warp, causing the corners to lift from the printing surface. I plan in printing a new one with heated platform and slightly higher printing temperature.
I did measure it though! Everything is tighly gated as usual (no smoothing) and measured at 80 cm due to my small workshop. No baffles used, waveguide sits on top of a box with face protruding a few cm over the edge.
First with my R2604/833000.

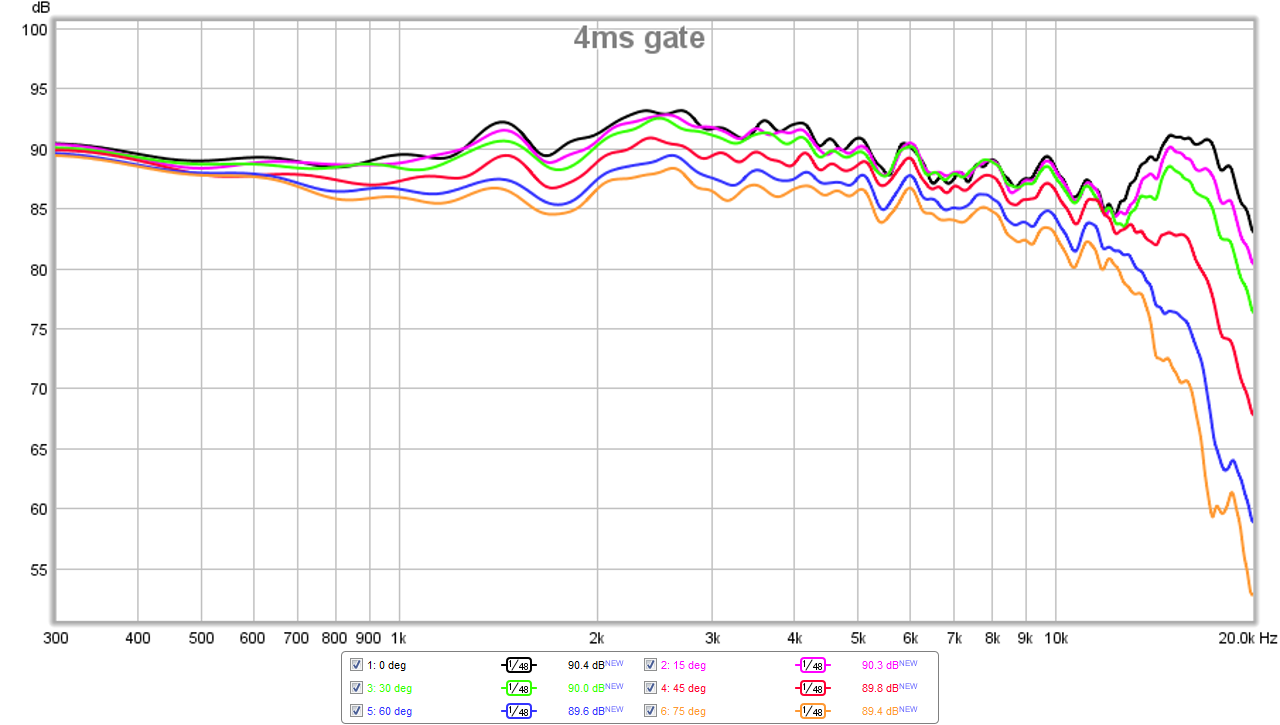
Horisontal (0, 15, 30, 45, 60 deg). CD from ~1.2 kHz to 10 kHz. Slightly weird on axis dip 5-8 kHz, but nothing major.

Vertical (0, 15, 30, 45, 60 deg).

Phase on axis.

Distortion on axis.

Distortion 15 deg off axis horisontal.

Distortion on axis 92 dB peak. I did this measurement as I thought the 85 dB peak was a little low. Still at acceptable levels.

Spectogram of the 92 dB measurement. Not used to making/interpreting these...
I had the idea of measureing at a closer distance to be able to make faster simulations.

Horisontal (0, 15, 30, 45, 60 deg) at 30 cm. Completely different behaviour, not a good idea.
With the D2604/830002

Horisontal (0, 15, 30, 45, 60 deg). Some weird stuff happens above 9 kHz, I guess that's due to a bad match between the dome and the 0° throat angle.

Distortion on axis. Suprisingly small difference between the two tweeters. I thought there would be much more distortion below 1 kHz for this one.
I redid the measurement of the 110 mm OS-waveguide that I printed first using the same method as the newer ones.

Horisontal (0, 15, 30, 45, 60 deg). I'll redo the simulations to see if I can get a better agreement to the measurement.
/Anton
Looks like fun! I think you really ought to consider a very large cardboard baffle for measuring those.
That is getting to be a large and deep waveguide for use with a tweeter. It will be interesting to see the degree of internal reflections once it is mounted in a baffle.It's funny you should ask! Yesterday I got a third waveguide printed, now full size: 210x130x85 mm.
The exit boundary condition is an approximation and so should be placed far enough away from the mouth of the waveguide so that it does not change the sound propagation within the waveguide. The simulations shown earlier had the exit boundary at a distance I would expect to be changing the sound in the waveguide. Perhaps only by an acceptable amount (it should be checked) but I doubt it could be brought much closer.I had the idea of measureing at a closer distance to be able to make faster simulations.
How sound propagates from the exit boundary to the listening position at 3 metres or so can be determined by integrating over the external boundary. I am not familiar with the details of the COMSOL acoustic module but I would be surprised if it cannot do this for you. You might need to perform a supplementary calculation to get the pressure on the outer wall of the speaker but you know all you need over the exit boundary. There is no need to have millions of tiny volume elements all the way out to the listening position when the sound waves are only propagating outwards.
Will it help the sagging or would that need more supports?The print quality is worst so far as there is some obvious delamination on the inside, probably due to a too low printing temperature. It did also warp, causing the corners to lift from the printing surface. I plan in printing a new one with heated platform and slightly higher printing temperature.
It is an interesting project and it will be good to see the simulations and measurements start to line up enabling the simulations to show what is causing the bumps and dips and hence how to modify them.
Yes, great work. Thanks for posting the polar data. I know that is a lot of work to make. Does anyone have a way to model the JBL LSR305's waveguide as a 3d model because that waveguide really is amazing. I measured the polars and they are probably the least variation I have seen of any waveguide. The LSR305 uses a 1in soft done tweeter crossed at 1725Hz. Here is what I measured:
The waveguide is about 6in wide so fits easily in the bed of a printer.

The waveguide is about 6in wide so fits easily in the bed of a printer.
Last edited:
RE: JBL LSR305, when you're seeing -5dB at 75° at frequencies far below what that waveguide could possibly control and where a 1" tweeter would be omni, doesn't that mean there's a problem with the center of rotation?
post145:
The dome driving the horn has a phase problem.
The signal from the tip of the dome arrives at the mouth before the signal generated at the edge can arrive at the mouth.
You need to delay the short length to match the long lengths so that all the signal arrives in phase.
This is what the acoustic lens does.
It introduces a longer path length to some of the dome output to make the distances more equal.
This is far easier with an inverted dome and probably why all the compression drivers start with an inverted dome. The distance from all points on the surface of the inverted dome are roughly the same distance from the throat and thence the same distance from the mouth. The signals arrive at the mouth in phase with each other. Only small corrections are then necessary.
post145:
The dome driving the horn has a phase problem.
The signal from the tip of the dome arrives at the mouth before the signal generated at the edge can arrive at the mouth.
You need to delay the short length to match the long lengths so that all the signal arrives in phase.
This is what the acoustic lens does.
It introduces a longer path length to some of the dome output to make the distances more equal.
This is far easier with an inverted dome and probably why all the compression drivers start with an inverted dome. The distance from all points on the surface of the inverted dome are roughly the same distance from the throat and thence the same distance from the mouth. The signals arrive at the mouth in phase with each other. Only small corrections are then necessary.
JBL is doing something clever in this regard. If you take a close look at the domes they use on their horns and waveguides, they're "squashed." Basically they're spherical like a Dynaudio D28, they're much flatter. They're about half the height of a semi-sphere.
That is getting to be a large and deep waveguide for use with a tweeter. It will be interesting to see the degree of internal reflections once it is mounted in a baffle.
The exit boundary condition is an approximation and so should be placed far enough away from the mouth of the waveguide so that it does not change the sound propagation within the waveguide. The simulations shown earlier had the exit boundary at a distance I would expect to be changing the sound in the waveguide. Perhaps only by an acceptable amount (it should be checked) but I doubt it could be brought much closer.
How sound propagates from the exit boundary to the listening position at 3 metres or so can be determined by integrating over the external boundary. I am not familiar with the details of the COMSOL acoustic module but I would be surprised if it cannot do this for you. You might need to perform a supplementary calculation to get the pressure on the outer wall of the speaker but you know all you need over the exit boundary. There is no need to have millions of tiny volume elements all the way out to the listening position when the sound waves are only propagating outwards.
Will it help the sagging or would that need more supports?
It is an interesting project and it will be good to see the simulations and measurements start to line up enabling the simulations to show what is causing the bumps and dips and hence how to modify them.
How would I measure the internal reflections?
I agree about the boundary conditions in simulations, I just have to get comfortable with the method and start measuring at an even greater distance. I don't think 1 m is considered far field for a 21 cm wide waveguide.
The sagging is mainly due to early delaminatons causing the next layer to not have anything to be placed on. I was watching the print and had to remove all support material in the mouth as it didn't adhere properly to the build plate.
I'm happy you are following this and providing input.
/Anton
You already are. They cause wiggles in the frequency response and bumps in the impulse response. At present they are a bit too strong because the baffle is missing leaving sharp edges which will diffract the sound more strongly.How would I measure the internal reflections?
When you are measuring and simulating the same thing and it is close to your speaker you should be in a position to look at every bump and dip and say what is causing it. Then you can look at how to modify the worst offenders by changing the geometry.
Thanks!great work, onni. thanks for posting the measurements.
This is what Dave Pellegrene does, albeit not that radically.Do you guys think it would help to narrow the throat like this? Or maybe even more narrow? JBL uses an elliptical hole a few mm in from the edge of the diaphragm.
Interesting measurements! Makes me a little more satisfied with the result from my waveguide that is considerably deeper and therefore has a lot more separation between the lines. I'll make a test baffle to see how it should behave in a "real" speaker.Yes, great work. Thanks for posting the polar data. I know that is a lot of work to make. Does anyone have a way to model the JBL LSR305's waveguide as a 3d model because that waveguide really is amazing. I measured the polars and they are probably the least variation I have seen of any waveguide. The LSR305 uses a 1in soft done tweeter crossed at 1725Hz. Here is what I measured:
The waveguide is about 6in wide so fits easily in the bed of a printer.
An externally hosted image should be here but it was not working when we last tested it.
I'm measuring an ~8" waveguide and get decent separation down to below 1 kHz (6 dB at 60 degrees at 1 kHz). I find it reasonable that he gets 5 dB at 75 degrees at 1.3 kHz.RE: JBL LSR305, when you're seeing -5dB at 75° at frequencies far below what that waveguide could possibly control and where a 1" tweeter would be omni, doesn't that mean there's a problem with the center of rotation?
Alright, I was thinking that maybe you could see it in the time domain by looking at a waterfall plot or something. The delay should however be too small to be easily visible now that I think of it.You already are. They cause wiggles in the frequency response and bumps in the impulse response. At present they are a bit too strong because the baffle is missing leaving sharp edges which will diffract the sound more strongly.
When you are measuring and simulating the same thing and it is close to your speaker you should be in a position to look at every bump and dip and say what is causing it. Then you can look at how to modify the worst offenders by changing the geometry.
I'll make a test baffle to see how that affects things. I should try to measure outdoors as well, at 2 m or more.
/Anton
Is it possible to scale a horn/waveguide non linearly so that throat diameter stays same or is changed and in vertical plane horn is stretched while in horizontal is compressed?
Yes, great work. Thanks for posting the polar data. I know that is a lot of work to make. Does anyone have a way to model the JBL LSR305's waveguide as a 3d model because that waveguide really is amazing. I measured the polars and they are probably the least variation I have seen of any waveguide. The LSR305 uses a 1in soft done tweeter crossed at 1725Hz. Here is what I measured:
The waveguide is about 6in wide so fits easily in the bed of a printer.
If you want to see some ridiculously consistent polars, check this out:


Frequency response needs some work, I'm re-designing it. But it sure is consistent.
more details here: 28 Weeks Later - Page 8 - Car Audio | DiyMobileAudio.com | Car Stereo Forum
Interesting project!
I'm looking to learn more about the different plots that REW outputs. Are these looking good? What would be the typical settings (how large of a decay is interesting in the waterfall plot)?


What is causing the almost constant level "ringing" above 10 kHz?
/Anton

The HF stuff looks like noise? The defaults in REW are for room analysis, so if you're looking at a driver without the room, you have to go and set it to use CSD mode, set the rise time and window according to the usable part of your impulse left and right of zero, and the time range to whatever's appropriate, 10ms or so would probably do it for the waveguides. Correct me if I'm getting anything wrong here, anybody, I use burst decay in ARTA every great once in a while, and never use this.
Ah, of course. Thanks for the guidance 🙂The HF stuff looks like noise? The defaults in REW are for room analysis, so if you're looking at a driver without the room, you have to go and set it to use CSD mode, set the rise time and window according to the usable part of your impulse left and right of zero, and the time range to whatever's appropriate, 10ms or so would probably do it for the waveguides. Correct me if I'm getting anything wrong here, anybody, I use burst decay in ARTA every great once in a while, and never use this.
Now I get more familiarly looking plots.

I need a outdoor measurement to get a larger window than 1.5 ms though.
/Anton
I had to set it at 1.5 ms, my workshop is only 2 m wide.That's why I have gate set at 4 ms to remove effects of room reflection.
/Anton
- Home
- Loudspeakers
- Multi-Way
- 3D-printing