60 Litres (2 cubic feet) closed box for a 6" Qts 0.38 reflex driver? Don't you smell a rat? That's huge! 😀Your calcs look flawed to me, using winisd I get 60 and 101 litres
29.7 L disregards stuffing. That would make it even smaller. 😎
Reflex tuning is a moveable feast, of course. My calculation tunes it to the Fs of the driver IIRC. But admittedly it's a simplistic calculation.
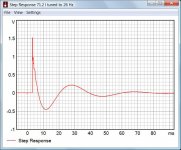
Reflex = 71.2 L (I don't have to think about that with a Qts of 0.38!)
Well, I guess it's down to personal preference 😉
With 71.2L and Fb = Fs = 26Hz you'd get the following:
An externally hosted image should be here but it was not working when we last tested it.
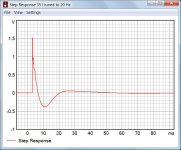
I would personally prefer a 35L box tuned to 20Hz:
An externally hosted image should be here but it was not working when we last tested it.
Marco
Which proves exactly the point that speaker dave was making! 😀
The problem with vented systems is that they require a larger cabinet than most designers are willing to give them. Run simulations and you will see that, once a woofer is chosen, the ideal vented box is roughly twice the volume of the ideal sealed box.
For commercially available systems that usually means that the vented alignments are typically undersized and boomy as a result. Years ago when I was at JBL they were selling a lot of products with the cabinet about right for sealed box, yet the systems were vented. The alignments were always on the boomy side (L150a excepted, which had wonderfully extended response).
If you have the right cabinet volume then you shouldn't need port loss, such as from a high aspect ratio slot vent. I would be concerned that such designs (including the Onken types) would be more prone to turbulence and noise. Resistive ports (including most "transmission line" types) are a very mixed bag, quickly losing the power handling and extension benefits that a well designed vented system should always have.
Regards,
David
I might also prefer the gentle rolloff of the second box but there is a slight tendency for a hump centred at ca 200 Hz. What if you drive it hard ?
Regards
Charles
Regards
Charles
A very interesting article
On the effects of BL and Cms non-linearities:
http://www.klippel.de/uploads/media/Assessment_of_Voice_coil_peak_displacement_XMAX_02.pdf
Marco
On the effects of BL and Cms non-linearities:
http://www.klippel.de/uploads/media/Assessment_of_Voice_coil_peak_displacement_XMAX_02.pdf
Marco
Which proves exactly the point that speaker dave was making! 😀
You completely overlook that your 71.2 l Butterworth alignment is boomy while the step response of Marco's 35 l alignment is very good. A proper aligned small box is superior to a large vented box, but a misaligned small box also can be worse. I agree with speaker dave that many commercial designs belong to the latter category.
Attachments
I'd be a bit careful with the conclusions drawn from the previous simulations (showing dramatically changing response). You can't look at change in compliance or change in Bl at high peak excursion and simply enter those numbers back into your model. Those are really just the instantaneous values at the peak of an excursion cycle. They would have to be put into a sophisticated distortion model where they would certainly impact excursion and distortion but wouldn't really shift the static response curve as shown.
As parameters do change with excursion, the vented box which reduces excursion (at least at some frequencies) can be advantageous.
Yes, there area lot of variables and choices involved so it doesn't pay to generalize too much.
David S.
As parameters do change with excursion, the vented box which reduces excursion (at least at some frequencies) can be advantageous.
Yes, there area lot of variables and choices involved so it doesn't pay to generalize too much.
David S.
My guess is that the second curve is not a reasonable
representation of the driver driven well beyond its linear range.
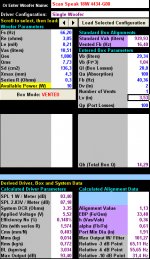
I gave my best to simulate it based on Marco's suggestion
that Cms drops to 0,4 and Bl to 3.
Fs was calculated based on new Cms and the same Mms.
Vas was converted from Cms. In order to get to Bl=3,
Qes was increased until I got it. Does not look as severe as
Marcos first simulation at 7 mm excursion.
Attachments


I'd be a bit careful with the conclusions drawn from the previous simulations (showing dramatically changing response). You can't look at change in compliance or change in Bl at high peak excursion and simply enter those numbers back into your model. Those are really just the instantaneous values at the peak of an excursion cycle. They would have to be put into a sophisticated distortion model where they would certainly impact excursion and distortion but wouldn't really shift the static response curve as shown.
As parameters do change with excursion, the vented box which reduces excursion (at least at some frequencies) can be advantageous.
Yes, there area lot of variables and choices involved so it doesn't pay to generalize too much.
David S.
True, and thanks for these careful thoughts.
Mine was just a quick-and-dirty stab at proving a general point (which I think still stands).
Marco
I gave my best to simulate it based on Marco's suggestion
that Cms drops to 0,4 and Bl to 3.
Fs was calculated based on new Cms and the same Mms.
Vas was converted from Cms. In order to get to Bl=3,
Qes was increased until I got it. Does not look as severe as
Marcos first simulation at 7 mm excursion.
Good! Thanks for doing a more refined job.
Qualitatively, I still think it proves the same point that I was making, though 😉
Marco
Not true.
Cms decreases with excursion (the suspension becomes stiffer and stiffer), and Fs is inversely proportional to Sqrt(Cms), so it increases.
Likewise, BL decreases with excursion (as the voice coil leaves the gap), and Qes is inversely proportional to BL^2, so it too increases.
I'm sure you can convince yourself of a lot of foolish things armed with a little knowledge and noodling around with a linear simulator. Garbage in, garbage out.
Here are some REAL large signal measurements compared to small signal. Note both Fs and Qts go down, and Cms goes up 😉
http://www.parts-express.com/pedocs/brochures/295-346-dayton-audio-ps220-8-brochure.pdf
Run your simulator with those numbers 😉
Given one acoustic suspension and one bass reflex tuned as close as possible to the same, the latter would have a greater time smear, or more group delay whichever you prefer to call it, would it not? they sound like technical words that mean slow, yet people really seem to hate calling a speaker slow-er or fast-er lol. I remember getting that out of this article a while ago after reading it. Maybe I have to read it again https://www.trueaudio.com/basslst2.htm
I'm sure you can convince yourself of a lot of foolish things armed with a little knowledge and noodling around with a linear simulator. Garbage in, garbage out.
Here are some REAL large signal measurements compared to small signal. Note both Fs and Qts go down, and Cms goes up 😉
http://www.parts-express.com/pedocs/brochures/295-346-dayton-audio-ps220-8-brochure.pdf
Run your simulator with those numbers 😉
Interesting document, thanks.
However, those Fs and Qts numbers appear to have been calculated "at the rest position", i.e. at X = 0, where in fact BL remains constant at its maximum value.
The document recommends that such values be used for "traditional linear modelling" instead of the conventional small-signal parameters, but then warns that "these parameters depend on the instantaneous state of the driver (peak value of displacement)". So it essentially says that they will be different when the voice coil is actually NOT in the rest position.
In other words, at X=Xmax, where BL < BL_0, Qts will go UP considerably from those values, as I was saying 😉
Marco
Given one acoustic suspension and one bass reflex tuned as close as possible to the same, the latter would have a greater time smear, or more group delay whichever you prefer to call it, would it not? [/url]
Yes, "all else being equal" that would be the case.
Alas, all else is never equal, though 😉 In the real world, it depends on how much extension you want, how shallow or steep the initial roll-off in the 'knee' region, how much excursion (and associated distortion) you are willing to tolerate in the passband, etc.
Marco
Given one acoustic suspension and one bass reflex tuned as close as possible to the same, the latter would have a greater time smear, or more group delay whichever you prefer to call it, would it not? they sound like technical words that mean slow, yet people really seem to hate calling a speaker slow-er or fast-er lol. I remember getting that out of this article a while ago after reading it. Maybe I have to read it again https://www.trueaudio.com/basslst2.htm
Vented will be 4th order and sealed will be second. With the same cut off and corner shape (say Butterworth) then 4th order will ring a little more.
Now, interestingly, if you compare the same woofer in 2 ideal designs, the vented version will be double the volume with nearly an Octave of extension. It may have more ringing and group delay but it will occur at a much lower frequency. It can actually have a much cleaner response at the mid bass frequencies where the sealed box is ringing.
Which will sound cleaner?
This dichotomy exists for any comparison, even for systems of the same order. Push the cut off lower and the ringing is always longer (is a constant number of cut off frequency cycles) hence greater group delay. Yet if there is no program material in the vicinity it can have no effect.
Personally I would vote for lower excursion and distortion over a difference in group delay.
David S
Interesting document, thanks.
However, those Fs and Qts numbers appear to have been calculated "at the rest position", i.e. at X = 0, where in fact BL remains constant at its maximum value.
The document recommends [...] So it essentially says that they will be different when the voice coil is actually NOT in the rest position.
In other words, at X=Xmax, where BL < BL_0, Qts will go UP considerably from those values, as I was saying 😉
You can't just say that Cms is 1/4 at xmax so Fs will be double....
The only way that what you are saying would be correct is if the driver were displaced from rest to some X<>0 by a DC signal and the operating point were changed. The operating point for a speaker running any sinusoidal steady state signal is varying +/- around x=0. This means the parameters in the Klippel LSI model are the correct ones to use in a linear simulator for modeling "large" signal behavior, and for determining how parameters change frequency response at larger signal levels. T/S parameters are based on linear time invariant equations.
To model the actual nonlinear behavior of the speaker, you would need parameters other than T/S (lumped) parameters, ones that vary with excursion and time and temperature.
For those with measuring gear, try this. Measure a well-used speaker's T/S parameters after leaving it rest for a day or so, then drive it to near Xmax for a minute near resonance and measure them again. Then leave it rest for a day or so and measure again. You will find (all other factors being equal) that the first and third measurements will be similar and the second will have a lower Fs, Q and higher Vas. The suspension has a sort of memory, and it loosens in response to signal.
If you model with the "linear" lumped parameters in the Klippel LSI specs (available for several drivers if you search) and compare large+cold with small signal, you will find the changes from small to large signal are actually fairly subtle in most cases.
When you get into areas where the resistance of the voice coil is appreciably larger, distortion is probably a greater issue than the frequency response changes, anyway.
So much for changing parameters being the cause of vented box "sound"...
The following links to a Klippel Analysis of a woofer, which we can use as a typical case:
HTML Report - Klippel GmbH
If you look at the plots about halfway down the page under the heading "Derived Loudspeaker Parameters" you will see the behavior that I described, namely as the driver moves away from the rest position Qts and Fs INCREASE.
I think that Ron is looking at the values in the table listed under the heading "Linear Parameters" just below that, which shows the behavior he mentions. These values, however, are at the "rest position" X=0 and are just used to compare the derived "small signal parameters" obtained when analyzing the large signal data so that these can be compared to the same obtained at small signal levels. It's just a sanity check. Since these values are at X=0 they are not a good representation of the parameter values in the case that the cone is making large excursions.
The motor for the above driver has some significant asymmetries, as shown in the plots. A driver with similar large signal behavior but a much more symmetric behavior of Qts and Fs can be found here:
http://medleysmusings.com/category/speaker-driver-tests/
Scroll to the bottom of the page for the relevant plots of Qts and Fs.
More info here:
http://www.klippel.de/fileadmin/kli..._Accurate_Linear_Parameter_Measurement_01.pdf
See the heading "Abusing the linear model" on page 5.
Last edited:
More info here:
http://www.klippel.de/fileadmin/kli..._Accurate_Linear_Parameter_Measurement_01.pdf
See the heading "Abusing the linear model" on page 5.
I have a bit of facility with this type of modeling, Charlie. Notice the Fs at different regimes in the heading you specify - lower Fs at large signal.
Just because Qts at x=5mm is different than at x=0mm doesn't mean that qts at +/- 5mm will be different. The same is true for all other parameters. In fact if you compare the Cms curve it predicts almost all of the variation in the others To use the nonlinear parameters you need a nonlinear model. The linear parameters are what you would use to estimate the effects of large signal on frequency response using a linear model. X=0 is where you live and what any signal used for creating a bode plot is symmetric around.
Let's revisit the paper starting at page 5 through the end carefully:I have a bit of facility with this type of modeling, Charlie. Notice the Fs at different regimes in the heading you specify - lower Fs at large signal.
Just because Qts at x=5mm is different than at x=0mm doesn't mean that qts at +/- 5mm will be different. The same is true for all other parameters. In fact if you compare the Cms curve it predicts almost all of the variation in the others To use the nonlinear parameters you need a nonlinear model. The linear parameters are what you would use to estimate the effects of large signal on frequency response using a linear model. X=0 is where you live and what any signal used for creating a bode plot is symmetric around.
Underneath the very table you are referring to (Table II) is the following paragraph:
The above paragraph essentially says that the results were derived using a type of analysis that does not fit the behavior well, e.g. fit a constant value across all values of cone excursion, which does not sufficiently describe large signal behavior.The compliance Cms increases by 50 % reducing the resonance frequency by 13 Hz. Surprisingly the results indicate that the suspension becomes softer while exposed to higher amplitudes. However, pushing the suspension by hand up to mechanical limits we feel that the suspension gets very stiff beyond a certain displacement. This contradiction, which can be observed on many drivers, shows that some extension of the linear model is required to explain the driver’s behavior in the large signal domain.
The paper goes on to describe the behavior in a more complete way. Essentially this says that, when the cone is driven to high excursions the apparent Thiele Small parameters are changing as a function of excursion during each cycle of the waveform. The instantaneous value as a function of the cone excursion is shown in the figures such as Figure 12. They also show in Figure 14 and describe in the text that the X=0 value is actually modulated when the driver is undergoing high excursions, such that Fs and Qts goes down. This is what is shown in table. But this is NOT an accurate characterization of the driver's response as predicted by TS parameters because it is essentially the single minimum value at X=0 and all other values for |X|>0 are larger. The authors explain it just before the summary section:
Whereas at low amplitudes the variations of fs(x) due to instantaneous displacement are small, above Xpeak= 2mm the dotted line (resonance frequency fs at maximal displacement) rises rapidly while the dashed line (resonance frequency fs at rest position) follows the tendency to lower values. This may be considered as the begin of the large signal domain. At Xpeak= 9 mm the instantaneous variations of fs(x) exceed more than one octave. The linear parameter measurement can reflect only a mean value of fs(x) that depends on the probability density function of the displacement.
The last sentence is saying that you need to take an average over the expected cone excursions, weighted by the probability distribution function describing how frequently the cone is at any particular excursion. In the most coarse grained sense this could just be some kind of average of the peak value and the value at X=0. For example, if the Xpeak = 7.5mm and Qts (reading Figure 12) is 1.2 and Qts@X=0 is 0.3 then Qts would average to something like 0.7*(Qts@Xpeak - Qts@X=0)+Qts@X=0, or Qts=0.93. This is definitely an "increase".
If you feel that this analysis is not correct, please follow up with some info about why and some examples, links to references, etc.
If you feel that this analysis is not correct, please follow up with some info about why and some examples, links to references, etc.
The problem you and marco are having is trying to apply nonlinear factors to a linear analysis.
If you read the paper that includes the "abusing the linear model" he is telling you that what he is doing in creating his "linear large signal" (LSI) parameters is essentially the probability distribution function that you mention. This provides the parameters for use in a linear model. He says it isn't particularly accurate, that's because if you want accuracy you need to use the f(x,t) parameters in a nonlinear analysis. That will show you the resultant waveshapes, distortion, etc....
I don't have the energy to "prove you wrong". Prove yourself right 😉
- Status
- Not open for further replies.
- Home
- Loudspeakers
- Multi-Way
- I Hate Ported Speakers!!!