My thoughts are that there are boundary reflections and there are room modes, which are two different things. I'm not sure I really care about the distinction as much as I care about the symptoms. But I do think this is an interesting discussion.
From the midrange band up, above about 200Hz, there is dense interference between source and multiple reflections and there are no distinct modes. Down low, the modes are separated enough in space and in frequency that they become distinct. But you can use multiple subs to smooth the low frequencies, introducing dense interference at low frequencies.
What occurs to me is that the transition region, between about 100Hz and 200Hz, localization cues start to prevent the use of multiple subwoofers. At least, they cannot be placed very far away. That's really my focus here, with the dual woofer or flanking subs. I'm not sure that I care about the distinction of whether the self-interference in the 100Hz to 200Hz range is from path length deltas or room modes. The mere fact that they exist prompts me to want to deal with them using a blending technique similar to the multisub concept, but at an acoustic scale more appropriate to the 100Hz to 200Hz range.
This is a measurement of a single loudspeaker done outdoors. One sweep was done with the loudspeaker on its back, with the sound source near the ground. The other sweep was done with it standing upright, with the sound source about 30" off the ground. It clearly shows the notch from the ground reflection.
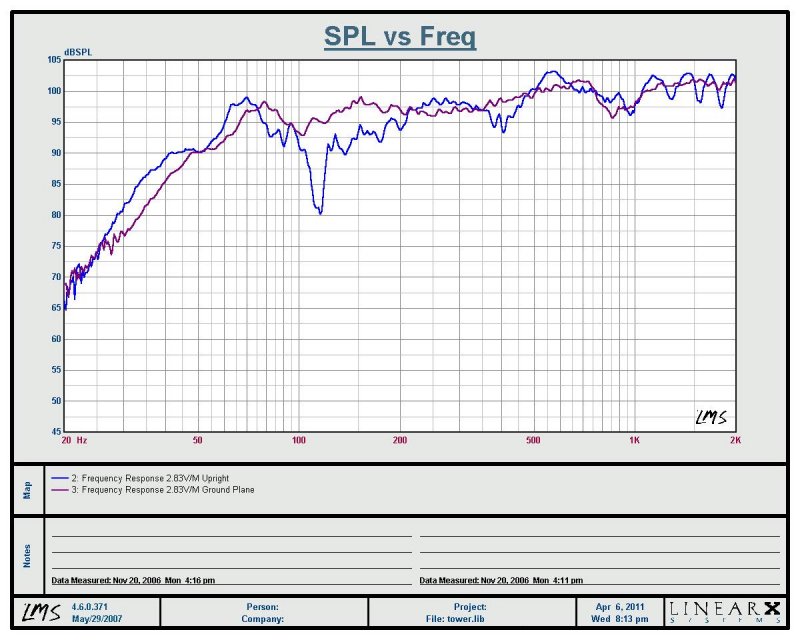
Obviously, this cannot be a room mode, as there was no room. It also seems a bit low in frequency to be a path length delta, although it certainly may have been. The frequency is off for a delta though, because the measurement microphone was on-axis (same height) with the source, 30". A path length delta would have put the notch about an octave higher, because this measurement was done one meter away.
The thing for me is, I don't really care whether it was a path lenth delta or self-interference straight up and down, other than the intellectual curiosity. What I am most focused on is the possibility of notches like this forming at all. It is clear that they do. At this frequency, distant subs can't be used to smooth them. Absorbent materials won't damp them. My approach has been to blend local sources, a pair of woofers, a midrange and woofer, or local flanking subs. I use any of those, and the 120Hz to 150Hz notch goes away.
From the midrange band up, above about 200Hz, there is dense interference between source and multiple reflections and there are no distinct modes. Down low, the modes are separated enough in space and in frequency that they become distinct. But you can use multiple subs to smooth the low frequencies, introducing dense interference at low frequencies.
What occurs to me is that the transition region, between about 100Hz and 200Hz, localization cues start to prevent the use of multiple subwoofers. At least, they cannot be placed very far away. That's really my focus here, with the dual woofer or flanking subs. I'm not sure that I care about the distinction of whether the self-interference in the 100Hz to 200Hz range is from path length deltas or room modes. The mere fact that they exist prompts me to want to deal with them using a blending technique similar to the multisub concept, but at an acoustic scale more appropriate to the 100Hz to 200Hz range.
This is a measurement of a single loudspeaker done outdoors. One sweep was done with the loudspeaker on its back, with the sound source near the ground. The other sweep was done with it standing upright, with the sound source about 30" off the ground. It clearly shows the notch from the ground reflection.
Obviously, this cannot be a room mode, as there was no room. It also seems a bit low in frequency to be a path length delta, although it certainly may have been. The frequency is off for a delta though, because the measurement microphone was on-axis (same height) with the source, 30". A path length delta would have put the notch about an octave higher, because this measurement was done one meter away.
The thing for me is, I don't really care whether it was a path lenth delta or self-interference straight up and down, other than the intellectual curiosity. What I am most focused on is the possibility of notches like this forming at all. It is clear that they do. At this frequency, distant subs can't be used to smooth them. Absorbent materials won't damp them. My approach has been to blend local sources, a pair of woofers, a midrange and woofer, or local flanking subs. I use any of those, and the 120Hz to 150Hz notch goes away.
Last edited:
All this presumes that the direct field and reverberent field are equally important, or that the steady state response (the combination) is what we hear. This just isn't so. The direct (or early) sound has much more importance than the later reverberent field in determining our perception of frequency balance.
A lot of studies and papers point to this. In equalizing PA systems researchers found that setting the direct response to flat gave best results even if the direct field was 15dB lower than the reverberent field. Lipshitz and Vanderkooy did a study where they independently manipulated the direct and reverberent fields and found that large holes in the reverberent field were generally unnoticed. They also found that flat power response was undesirable both in combination with rising direct response (the easiest way to achieve it) or even with flat direct response. If you look at the speakers that did well in Floyd Toole's studies, they generally had falling power response and a variety of power response holes. They overwhelmingly had smooth and flat axial response.
Its easy to measure the steady state response in a room but there is no evidence that it is the subjectivly right thing to measure.
David S.
Hi David,
Your post here agrees with what has been my understanding over the years, yet recently I've come across a few situations where it seemed to me that the in room power response was making a much bigger difference than I'd expect. I wonder if studies done in large rooms, say for PA applications, apply to small scale rooms found in a home. Do you have any thoughts along these lines?
Sorry, I'm backing up here to a very old post.
Wayne, that's an interesting measurement result. Next time I take my stuff outside I'll try and see if I can reproduce it.
Although I haven't studied the excel worksheet formulas, I believe this is pretty much what FRD Room response calculator does - you set a maximum number of reflections to be analysed, and from this it creates a 3 dimensional "stack" of rooms placed all around the actual room, each containing appropriately placed virtual sources that are equivalent to the reflections. Enough virtual rooms are created so the minimum number of reflections is satisfied.The best way to picture it is as if the walls, floor and ceiling of your room were all mirrors. You would be able to see the speaker in question and multiple reflections above, behind and beside for a speaker near a corner (1 speaker and 7 images). Linkwitz shows it well with a picture of a model speaker in a mirrored corner. The beauty of thinking of it this way is that it makes the path of the sound ray obvious, it simply comes in a straight line from the various image loudspeakers.
Not only do these 8 sources exist, but the opposite wall adds another group. In fact, since sound can bounce back and forth between walls a large number of times, many images would be visible if you looked into the mirrors in any direction (just as you see lots of reflections if you stand between two parallel mirrors.
If we wanted to create a computer model of this we would only have to set up the geometry of the multiple reflections and give them all a driving impulse at the same time, t=0. We would notice 2 things, first the far speakers would have a greatly reduced level simply from the greater distance (1/R loss). Secondly, the model should include absorption loss for every surface that a distant sound ray passes through. If our walls have an alpha of .4 (40% absorption) then this would be compounded by every reflection (or boundary transition, in our model). From these two factors we can probably simplify the model by cutting off images more than 5 to 10 "rooms" away and get nearly the same result.
A second picture attached shows a single speaker in a rectangular room with many image rooms surrounding it. This model alone is enough to calculate the standing waves of the system in the room, at least in that plane. Note that a proper model has to be 3 dimensional with rooms above and below.
It then traces a ray from each virtual source (hundreds, or thousands depending on the number of reflections configured) back to the listening point. Inverse square law loss is accounted for with the distance to the virtual sources, and the reflectivity coefficent of the real walls will be used to calculate loss as the ray passes through each imaginary boundary.
As far as boundary cancellation/addition effects go this should be pretty accurate, the main limitations are it only simulates simple shoebox shaped rooms, (also not taking into account furniture etc) assumes the speakers are point sources, and relies on knowing a reasonable approximation of reflectivity coefficient of the boundaries. (And makes the assumption they don't change with frequency, which is false, especially at bass frequencies where the wall panels resonate)
However, I do wonder how this model can take into account room modes ? Two of the three primary room modes are the floor/ceiling mode and the left/right wall mode, both of which are nearly at right angles to the listener. If the simulation works by tracing rays from all the virtual sources only to the listener, surely it's not analysing room modes which are perpendicular to the speaker listener axis ?
Even though those two room modes are perpendicular to the listener, there is no doubt that they exist and can be heard by the listener. The obvious example is the left/right room mode, because this is excited by a single (left or right) speaker, but two symmetrically placed speakers working in dual mono at bass frequencies will suppress the lowest lateral room mode - something which is not predicted by the reflective analysis - the FRD tool simply shows a uniform 6dB increase in response going from one speaker to two which are symmetrically placed in a symmetric room.
From this I have to wonder whether a simple reflective analysis is the full story.
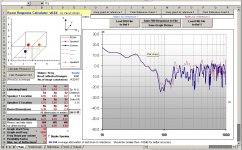
I decided to take some more measurements in-room and compare them to the simulator to see how much correspondence I could get.
The exact dimensions of the room and placement of mic and speakers can be seen in the spreadsheet, but in summary the room is 4.8m long by 3.45m wide by 2.4m high. The normal midbass drivers are 0.7m high and the microphone is 1.1m high at approximately 3.2m from the speaker. Only the left speaker was measured and simulated.
First of all, a simplified floor bounce calculation based on path difference from the following page:
Floor/Ceiling Reflection Calculator
Plugging in the figures of 70cm high woofer, 110cm high microphone, and 319cm mic to speaker distance gives a predicted first floor bounce of 384Hz.
Room response calculator (image attachment 2) shows a predicted response for the 0.7m high woofer at the listening position in dark blue, whilst the red line is the response with the woofer height lowered to 0.2m - about where the flanking woofer is.
The 0.7m response doesn't suggest anything too serious wrong with 384Hz, but does show a mild depression around 200-280Hz, and a huge hole around 100Hz, or more probably two adjacent holes side by side.
Of particular interest is that the red line at 0.2m shows significant improvement in the 250Hz hole, as well as an increase at ~380Hz, but only shows a very modest improvement from 80-100Hz, and none at all from 110-150Hz.
So how do both of these compare to actual measurements ? Image attachment 1 is a 1/24th octave un-gated response from the listening position at 3.19m. As it's ungated it's essentially the power response of the room so doesn't look too pretty at the top end, but it should serve our purpose below ~400Hz.
Red is the response of the 2 way speaker with 0.7m high midbass driver on it's own, light blue is the response with the "flanking" floor level woofer added in.
Dark blue at the top is the subtractive difference between the two, making it much more obvious where the changes are.
Points of interest -
1) No change at 384Hz where a hole is predicted by simplistic floor bounce calculation, nor is a hole present, in fact there is a slight peak. There is a small hole at 334Hz, however the flanking woofer has no impact here. Both these holes and peaks are highly temporal and shift with small microphone movements, and aren't anything to worry about IMO.
2) Both measurement and FRD's simulator agree about a small hole being present around ~200-250Hz, and being filled in by a lower woofer. The measured change seen on the difference graph is up to 5dB.
3) Actual measurement shows a huge hole around 100-135Hz, while FRD predicts a huge hole between 80-140Hz. Where things diverge though, is what happens with a lower woofer. FRD says a small improvement between 80-100Hz, and no improvement from 100-150Hz, while measurement shows an 8dB improvement centred around 110Hz.
This is interesting because (a) it doesn't coincide with reflective prediction as done by FRD, (b) doesn't quite coincide with the 2nd order floor/ceiling node, which should be occurring at 143Hz not 110Hz, but does come quite close to 1/4 wavelength height off the floor, which is 122Hz.
My hunch is that it's still somehow related to the 2nd floor/ceiling mode, and that the reflection calculator is not modelling this, but to be honest these measurements pose more questions than they answer...I'm even less sure now than I was before about exactly what's going on from 100-200Hz, and what the true source of the notches are...
No impact, or very little ? I'm not convinced of it having any effect myself, but threw it out there as a possible idea that might account for the measurements.Finally, it is suggested that the woofer sees its reflection and that the radiated power is modified by the presence of its reflection. My understanding is that that is not the case. The woofer's mechanical impedance is great enough that the reflected sound has no impact.
Attachments
Last edited:
Hi David,
Your post here agrees with what has been my understanding over the years, yet recently I've come across a few situations where it seemed to me that the in room power response was making a much bigger difference than I'd expect. I wonder if studies done in large rooms, say for PA applications, apply to small scale rooms found in a home. Do you have any thoughts along these lines?
Sorry, I'm backing up here to a very old post.
Aside from the Lipshitz and Vanderkooy study, most of the tests have been done in larger rooms under PA or cinema conditions. As far as I can tell the effect is on a continuum. With large rooms the divergence between steady state response and direct response will be considerable, in a small room it will bo on the order of a couple of dB rolloff at HF, so ignored by some.
Papers relating to PA and power response vs. direct field:
Theoretical and Practical Considerations in te EQ of Sound Systems by Conner (JAES April 67) He advocates the EQ of the direct field only, even if it is 15 dB submerged in the steady state response.
Toward Complete Laboratory-Design of Sound Reinforcement Systems Queen AES preprint 689. He advocates anechoic design of systems and then to ignore the room effects. "The perceived quality of a sound reinforcement system is dependent upon the spectral characteristics of the direct field. The spectrum of the early reflections may be a second order influence."
Effect of Direct Sound on Perceived Frequency Response of a Sound System, Samuel Bridges. He EQs a far system to sound like a near system and then finds that the steady state response of the far system falls while the TDS response is flat.
My favorite paper on cinema sound systems: Standardized Sound Reproduction in Cinema and Control Rooms by Lennart Ljungberg (SMPTE journal December 1969). He also does a near speaker compared to a far speaker tests and comes up with a steady state target. Also read Schulein on this, although his conclusions are suspect.
You can read all the papers on the Cinema X curve but you should be aware that the X curve is not just about the right EQ for a cinema system, but has a lot of baggage related to its evolution from previous curves that were more about optic track noise and headroom.
I did a quick study at PSB where I measured several systems at a variety of distances and then divided out the system's direct response. At a 3 to 4 meter listening distance the effect of transition to far field was on the order of 2dB as a tilt or downshelf. I'll dig out the curves if I can find them. A difference of that magnitude would be ignored by some (EQing the far field to flat would be in the realm of variations of "taste".)
David
PBMandrake and speaker dave, how do you get that program to work?
Room Response Calculator - Reflective Accumulation Simulation Software
I downloaded the file and it extracted, but all I got was a 6 kB file with .frd extension.
Room Response Calculator - Reflective Accumulation Simulation Software
I downloaded the file and it extracted, but all I got was a 6 kB file with .frd extension.
Last edited:
Maybe you've covered this and I missed it, but how do you account for the 2-pi to 4-pi transition for a mid-woofer in the simulations? A mid-woofer facing forward and mounted at 0.7m will be in 2-pi above step and transition to 4-pi by somewhere around 100Hz on a typical baffle. The vertical polar response of that midwoofer, before floor influence, is going to have a drop in level during this transition due to baffle, then there's the change with directivity that possibly isn't an issue at these frequencies. At lower frequencies, the floor is going to start a transition in midwoofer response back towards a 2-pi environment as a woofer responds when placed close to the floor, so I would expect to see some kind of droop in response in this transition region when the floor boundary comes into play. I call it a boundary because I'm not seeing it as purely a reflection at these frequencies. It is higher up, but at some point it's boundary reinforcement. At least this is how I see it at the moment.The exact dimensions of the room and placement of mic and speakers can be seen in the spreadsheet, but in summary the room is 4.8m long by 3.45m wide by 2.4m high. The normal midbass drivers are 0.7m high and the microphone is 1.1m high at approximately 3.2m from the speaker. Only the left speaker was measured and simulated.
Dave
Very strange, so do I when I try it. The copy I have I downloaded years ago, even though it's the same version shown in the screen-shot near the link.PBMandrake and speaker dave, how do you get that program to work?
Room Response Calculator - Reflective Accumulation Simulation Software
I downloaded the file and it extracted, but all I got was a 6 kB file with .frd extension.
I've attached a copy of the spreadsheet as a zip file, hopefully this is ok with the authors...
Attachments
The simulation doesn't account for baffle step - as I mentioned it models the reflections assuming that the speaker is an ideal point source - therefore it doesn't take driver diameter or baffle into account, and assumes omni-directional radiation.Maybe you've covered this and I missed it, but how do you account for the 2-pi to 4-pi transition for a mid-woofer in the simulations?
A mid-woofer facing forward and mounted at 0.7m will be in 2-pi above step and transition to 4-pi by somewhere around 100Hz on a typical baffle. The vertical polar response of that midwoofer, before floor influence, is going to have a drop in level during this transition due to baffle, then there's the change with directivity that possibly isn't an issue at these frequencies.
For a small baffle/speaker this is a reasonable assumption up to a few hundred Hz, but obviously errors are going to creep in for large baffles or drivers, but probably not as low as 100Hz.
The general effect of a large baffle/driver compared to the simulation would be that you'd get more output at higher frequencies (as expected) but also less response ripples as off-axis response reduces, since contribution from room reflections reduces...much like a baffle diffraction simulator it's useful to find out at what frequencies peaks and dips will tend to occur, but with that level of modelling can't accurately calculate the exact amplitudes, especially when the boundary coefficients aren't known accurately enough.
Despite that it does still give surprisingly good results in most rooms I've tried it in, the biggest source of error tends to be trying to guess or approximate the boundary coefficients.
As far as I can see, the reflection model used does simulate the transition back towards an approximate 2pi response when close to the floor, which is easy to verify by starting with all coefficients set to zero, then increase the floor coefficient to see the effect.At lower frequencies, the floor is going to start a transition in midwoofer response back towards a 2-pi environment as a woofer responds when placed close to the floor, so I would expect to see some kind of droop in response in this transition region when the floor boundary comes into play. I call it a boundary because I'm not seeing it as purely a reflection at these frequencies. It is higher up, but at some point it's boundary reinforcement. At least this is how I see it at the moment.
When you think about it the floor reflection is represented by another woofer with a slightly reduced output placed an equal distance below the floor - and two such woofers in free space would increase the output over a broad range of frequencies below the first floor bounce cancellation. Try it and see.
It also accounts for room gain at low frequencies below the lowest room mode.
So, baffle step response - not included in the simulation, floor boundary gain - included in the simulation, IMHO. I'm uncertain as to whether lateral and vertical (relative to the speaker-listener axis) room modes are properly simulated with this model or not. The longitudinal mode in line with the speaker-listener axis is, with that mode's bump clearly evident in simulations.
Last edited:
Some firewalls won't let a direct exe download, I see this as 6KB files when this occurs.Very strange, so do I when I try it. The copy I have I downloaded years ago, even though it's the same version shown in the screen-shot near the link.
I've attached a copy of the spreadsheet as a zip file, hopefully this is ok with the authors...
Dave
I'm not behind any special firewall, just an ADSL NAT router and I see the same thing. It's a self extracting EXE and the self extractor is working fine, it's just the contents of the archive that are wrong. I'd say they tried to upload an updated version and screwed up...Some firewalls won't let a direct exe download, I see this as 6KB files when this occurs.
...Actual measurement shows a huge hole around 100-135Hz, while FRD predicts a huge hole between 80-140Hz. Where things diverge though, is what happens with a lower woofer. FRD says a small improvement between 80-100Hz, and no improvement from 100-150Hz, while measurement shows an 8dB improvement centred around 110Hz.
This is interesting because (a) it doesn't coincide with reflective prediction as done by FRD, (b) doesn't quite coincide with the 2nd order floor/ceiling node, which should be occurring at 143Hz not 110Hz, but does come quite close to 1/4 wavelength height off the floor, which is 122Hz.
...
These are the kinds of things I've seen too. I had always assumed the floor bounce notch was related to a path length delta, as others have expressed in this thread. But when I actually calculated them, the numbers were off. Room modes might explain this indoors, but not outdoors. So I began to think it was something else, and like you saw, it was quite close to the frequency where the sound source was 1/4λ from the ground.
The 1/4λ mirror notch seemed a reasonable explanation. I even measured a few times outdoors with the microphone on the ground and saw the notch too, although looking back, I must not have saved any of those. But I am certain I did measurements with the microphone on the ground and the sound source a couple feet up and saw a notch. Might have to do that again, as this would eliminate the path length delta.
It is interesting, worth further investigation. It might shield new light on the matter to understand exactly what causes these notches. Might help us to understand what we're missing with the simple calculated reflection and modal models.
The thing is, my biggest point is that we see notches in this region with some regularity. Whether they are room modes or path length deltas, they're there. So to me, the flanking sub and/or blended woofers are an attractive configuration. Whatever causes the notches between 100Hz and 200Hz, this approach mitigates them.
Where the notch is depends, of course, on where you put the microphone. Measuring at the traditional 1 meter on axis will show a different notch frequency than measuring at the design listening distance . . . the floor bounce notch is not a fixed property of the loudspeaker . . . it is determined by the relative placements of the speaker and listener, so it's determined by two heights and a distance.The 1/4λ mirror notch seemed a reasonable explanation. I even measured a few times outdoors with the microphone on the ground and saw the notch too, although looking back, I must not have saved any of those. But I am certain I did measurements with the microphone on the ground and the sound source a couple feet up and saw a notch.
Well, yeah. I know how the path length delta notch is formed.
My point is two fold:
1. I've seen notches that appear to be lower in frequency than I would have expected from path length delta cancellation, even outdoors, which eliminates the possibility of room modes.
2. I've regularly seen fairly severe notches indoors in the 100-150Hz range. Naturally, this is a more complex environment where reflections are concerned, including reflections from the floor, the wall behind the speakers, the ceiling and all other boundaries. The main point is that I see notches in most room (from modes and/or path length cancellation) above 100Hz.
This second point is actually what I'm mostly focused on. You can use multisubs to smooth room modes below 100Hz, but above 100Hz is a special case that some people call the transition region. Localization cues start to emerge there, so you don't want sound source positions too far away or at odd angles.
I think you've missed the point of the recent conversation about notches in this frequency region - we're all well aware of how the traditional floor-bounce notch forms due to unequal path length of the reflection being 1/2 wavelength out of phase with the direct signal.Where the notch is depends, of course, on where you put the microphone. Measuring at the traditional 1 meter on axis will show a different notch frequency than measuring at the design listening distance . . . the floor bounce notch is not a fixed property of the loudspeaker . . . it is determined by the relative placements of the speaker and listener, so it's determined by two heights and a distance.
But this is not the only effect going on, and doesn't account for the notches measured. In my specific example the calculated floor bounce notch of 384Hz is not even present at a far listening distance, (probably filled in by other random reflections from other room boundaries, and also reduced due to baffle directivity reducing the off axis response) whereas the largest notch between 100-140Hz is not even remotely in the same frequency range as the calculated floor bounce.
Of course the in room notch I'm measuring in this instance may be a combination of several different boundary reflections that all happen to coincide near the same frequency, but that doesn't explain why lowering the woofer has a large effect in reality that the simulation doesn't show.
It also doesn't explain measuring such a notch outdoors (which doesn't correspond with the calculated floor bounce frequency) although to be fair I haven't done such measurements myself and don't currently live somewhere where outdoor measurements are possible.
The point is we're trying to identify the root cause of notches that so often seem to form between 100-200Hz but don't seem to correspond to standard floor bounce or room modal effects. To do a more thorough study would require outdoor measurements as well as measurements in rooms with different combinations of ceiling height, driver height, and listening position.
I've seen notches that appear to be lower in frequency than I would have expected from path length delta cancellation, even outdoors, which eliminates the possibility of room modes.
You should do additional measurements outside 🙂
I don't believe I have. Perhaps you've missed my point, that none of the "actual measurements" discussed above include the actual speaker-microphone distance, and the "1/4 wavelength notch" frequently mentioned is simply an artifact of a microphone placement close to the speaker. When you place the microphone in a "normal" listening position you are primarily seeing, and talking about, room modes (and perhaps ceiling and wall bounce). The floor bounce notch is substantially higher in frequency, and actually can be at least partially managed by Earl's "thick carpet".I think you've missed the point of the recent conversation about notches in this frequency region
So I guess you didn't read post #1624 where I gave precise dimensions of my room, speaker, and microphone placement (in the simulator spreadsheet) ? This was measured with the microphone 3.2 metres from the speaker.I don't believe I have. Perhaps you've missed my point, that none of the "actual measurements" discussed above include the actual speaker-microphone distance, and the "1/4 wavelength notch" frequently mentioned is simply an artifact of a microphone placement close to the speaker.
I mentioned as much in post #1624 where I said that the floor bounce notch (at 384Hz) wasn't actually measurable at all, most likely because the potential notch is filled in by other reflections at semi-random phase relationships.When you place the microphone in a "normal" listening position you are primarily seeing, and talking about, room modes (and perhaps ceiling and wall bounce). The floor bounce notch is substantially higher in frequency, and actually can be at least partially managed by Earl's "thick carpet".
However neither room modes or boundary cancellations adequately explain the large notch I measure at around 110Hz, and the large ~8dB increase in response in this frequency range by using a low woofer is not predicted in the reflection based simulation. The simulation predicts the presence of a notch, but not the elimination of the notch by lowering the woofer.
Do you have a good explanation for a notch at precisely this frequency (too far away from the 2nd order wall/ceiling mode at 143Hz) which goes away as the woofer is lowered ? All the dimensions are there in the spreadsheet if you have a better way to calculate it...
The 1/4λ mirror notch seemed a reasonable explanation. I even measured a few times outdoors with the microphone on the ground and saw the notch too, although looking back, I must not have saved any of those. But I am certain I did measurements with the microphone on the ground and the sound source a couple feet up and saw a notch. Might have to do that again, as this would eliminate the path length delta.
I've done plenty of ground plane measurements and never seen any extra wiggles from one woofer seeing its reflection, if thats what you mean. We debated this at Classic Speakers for a while. It seemed to me that the Allison tests, where he measured/calculated woofer power against a boundary, were also totally explained by the squareing and integration of the simple 2 path responses.
David
- Status
- Not open for further replies.
- Home
- Loudspeakers
- Multi-Way
- 'Flat' is not correct for a stereo system ?