Most of our wives won't allow maxipads all over the walls in the living rooms where the listening system resides. I get away with a "little", but a little doesn't do much objectively.
When your wife really loves you 😀 . Like the wife of Ethan Winer in this video every thing is possible.JoshK said:Most of our wives won't allow maxipads all over the walls in the living rooms where the listening system resides. I get away with a "little", but a little doesn't do much objectively.
dlr said:None of the data at two of the sites mentioned are presented in terms of THD. Multi-tone tests are the norm and both John and Mark point out that their data has to be taken with reservations and that their tests are not the last word. Neither claim anything definitive, but trends do show up with a fair amount of correlation between the two insofar as testing is concerned. And I don't think that either one would shrink from stating their beliefs from their experience. Neither one is selling a product.
True. Those sites break down HD into its separate orders. That being said, mean and max % of 2nd and 3rd HD did not correlate significantly with listener preferences. To be fair, the study was clearly not powered to detect small differences, so all I can conclude from Olive is that 2nd/3rd HD over a wide bandwidth does not influence listener preferences to a degree that I probably care about.
Also, as another study pointed out, speakers with higher distortion also tend to have less smoothness/flatness over that samples of 70 loudspeakers. Problems with smoothness/flatness was demonstrated in the blinded listening test to account for a lot of the perceived dfferences in sound quality. Thus, distortion may merely be a CONFOUNDER. That is, speakers with higher distortion levels may sound worse NOT because of the distortion, but because of problems with smoothness/flatness, which tend to also be found in higher distortion speakers. If you understand why ashtrays don't cause lung cancer even though people with ashtrays are more likely to develop lung cancer, you can understand the aforementioned. Smoking causes lung cancer. Ashtrays do not. But if someone just looked at people with ashtrays, and found a high incidence of lung cancer, they might erronously conclude that ashtrays are associated with lung cancer. This is why speakers with higher distortion might sound worse, but it's not necessarily because of the distortion. How can we tell? Regression studies. Done. (and multivariate analysis, but that wasn't done. doh.) ...but that's neither here nor there because I have STILL yet to see ANY study that demonstrates that HD (even when separated into its orders) and IMD correlate with perceived listening differences when done in a controlled manner (which can include blind listening)...and I'm not even asking for a study that is controlled for other confounders.
I see no difference between that and using nothing more than the on-axis response for ad copy.
Dave
An anechoic on-axis response tells us things that are indeed correlated with sound quality. Flatness, smoothness, slope of a regression line, and LF extension can be extracted from such a response and can predict some of how a loudspeaker will sound compared to another. I would definitely check out that Olive paper.
SG
Re: Re: Just a new waveform?
Then why is it most speakers sound clearly distorted with sinewaves allready at medium levels?
Nonlinerities + wide bandwith signals = IMD. Do you propse that music typically is a good masker of IMD?
What about Klippels tests? Bogus according to you?
I don't think you answered that earlier when I brought up Klippel.
/Peter
gedlee said:
The ear cannot detect low order distortion because it is masked. Loudspeakers tend to only have low order nonlinearity.
Then why is it most speakers sound clearly distorted with sinewaves allready at medium levels?
Nonlinerities + wide bandwith signals = IMD. Do you propse that music typically is a good masker of IMD?
What about Klippels tests? Bogus according to you?
I don't think you answered that earlier when I brought up Klippel.
/Peter
JoshK said:Dr. Geddes,
I don't disagree with the majority of your above statement. I guess it boils down to most of us audiophiles are stuck with the room we got, which sucks objectively speaking. In that context, with those constraints, there are only so many things that can be done so idle minds turn to things that can be done even if they don't matter.
Humbly,
Josh
Josh
I understand. Lidia said this exact same thing when she went to RMAF. She said after looking around that people can't buy good loudspeakers so they buy what they can and hope that it helps. They don't ask for vailidity of the purchase because none is required - it's the "hope and faith" that counts.
Originally posted by smellygas An anechoic on-axis response tells us things that are indeed correlated with sound quality. Flatness, smoothness, slope of a regression line, and LF extension can be extracted from such a response and can predict some of how a loudspeaker will sound compared to another. I would definitely check out that Olive paper.
SG
I understand that. The point is that on-axis response can also be very deceiving. It doesn't tell nearly enough. I've designed crossovers that were within +/- 1db on the design axis that sounded just plain bad. You cannot tell enough from a single on-axis FR as to how it will be perceived.
Dave
smellygas said:
An anechoic on-axis response tells us things that are indeed correlated with sound quality. Flatness, smoothness, slope of a regression line, and LF extension can be extracted from such a response and can predict some of how a loudspeaker will sound compared to another. I would definitely check out that Olive paper.
SG
It is indeed true that the listening axis (which need not be the normal axis) tells a great deal, but as Dave says, its only a part of the story and not that big a part IMO. My compaint with JBL and what they have done is that they won't disclose all of the details of their measurement. That makes it impossible for us to corraborate the measure or do it ourselves. Until they tell us precisely how they weight the data to get such a good correlation it isn't very useful.
I asked Sean and Floyd about this precise point and got the impression that they weren't too happy about Harmans unwillingness to disclose the details. They both said that we "should be able to guess" but my point is that they "should be able to tell us".
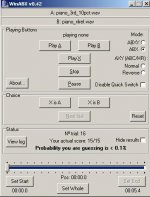
I did a quick test with WinABX. The listening room at the ABX website provides a short piece of piano with several levels of harmonic distortion. I could easily detect 10% 3rd order harmonic distortion. After 10 correct answers my probability of guessing was below 0.1% and I went on to reach a 15/15 score. I could go on and on and on. It is very easy to detect 10% distortion. Just try the 30% sample. It almost doesn't sound like music anymore.
See http://web.archive.org/web/20070813001013/http://www.pcabx.com/
for the software
and http://web.archive.org/web/20070829215910/www.pcabx.com/training/index.htm
for the samples.
See http://web.archive.org/web/20070813001013/http://www.pcabx.com/
for the software
and http://web.archive.org/web/20070829215910/www.pcabx.com/training/index.htm
for the samples.
Attachments
Dr. Geddes, I talked negatively about JAES and EIEEE's willingness to publish papers which don't disclose at this level, that aren't as transparent, and was told this "never happens." In my field, in psychology, if you aren't so transparent that someone can recreate 100% what you have done by reading your article, then you aren't allowed to publish. In fact, the description of the purpose of a professional peer reviewed article is that peers can review what was done and potentially recreate it, to confirm the results. It's happened where transparent studies were published, but recreations of the studies couldn't match the results. It's common in the Medical Field.
I think it shows one of the ways that marketing and business get in the way of good science in this field. Like I said, it's not just that this type of thing doesn't happen or is unheard of in many other fields, it's often not allowed. The other issue I have is that in my field of science, there are very strict guidelines for conducting human subjects research, and one of the ways that this is ensured is through the University IRB. This has the added advantage of giving a level of confidence in the professionalism and rigor the research was conducted with. University IRB's, Government IRB's, and independent research IRB's all follow standards that ensure this level of rigor and consistency.
I think it shows one of the ways that marketing and business get in the way of good science in this field. Like I said, it's not just that this type of thing doesn't happen or is unheard of in many other fields, it's often not allowed. The other issue I have is that in my field of science, there are very strict guidelines for conducting human subjects research, and one of the ways that this is ensured is through the University IRB. This has the added advantage of giving a level of confidence in the professionalism and rigor the research was conducted with. University IRB's, Government IRB's, and independent research IRB's all follow standards that ensure this level of rigor and consistency.
jeroen_d said:I did a quick test with WinABX. The listening room at the ABX website provides a short piece of piano with several levels of harmonic distortion. I could easily detect 10% 3rd order harmonic distortion.
How do you know it was pure 3rd order? Because that's what it said on the web site? It's not trivial to do these simulations correctly and if not done correctly one can come to some awfully invalid conclusions.
gedlee said:
How do you know it was pure 3rd order? Because that's what it said on the web site? It's not trivial to do these simulations correctly and if not done correctly one can come to some awfully invalid conclusions.
A quick check of those sample files show an almost 3dB average rms amplitude difference. Either the ABX tool fixes this or the test is totally invalid. I can't believe the folks that claim to have invented it fail to notice this.
Nonlinearity will change the RMS levels of a signal, but this is one of the confounding factors in any test.
I could post a pure third order distortion that was almost 50% and wouldn't be audible.
I could post a pure third order distortion that was almost 50% and wouldn't be audible.
jeroen_d said:I did a quick test with WinABX. The listening room at the ABX website provides a short piece of piano with several levels of harmonic distortion. I could easily detect 10% 3rd order harmonic distortion. After 10 correct answers my probability of guessing was below 0.1% and I went on to reach a 15/15 score. I could go on and on and on. It is very easy to detect 10% distortion. Just try the 30% sample. It almost doesn't sound like music anymore.
See http://web.archive.org/web/20070813001013/http://www.pcabx.com/
for the software
and http://web.archive.org/web/20070829215910/www.pcabx.com/training/index.htm
for the samples.
That's pretty interesting. I'm actually surprised that there was a 3dB RMS difference, as Scott Wurcer pointed out (good pickup). I would have expected any ABX site to control for level - it's pretty basic. Also, I would also like to know how the distortion was generated. As we saw very clear in some other published worked, the loudspeakers that had higher levels of distortion also had higher levels of frequency response nonlinearities. It could have been the frequency response changes that caused the audible difference, not the distortion. However, in this case, the gross level mismatch of 3dB is a serious confounder that renders the test inconclusive. What this mean is that we would believe that there is a 99.9% chance that the two samples you heard were difference, but the audible difference may or may not have been due to distortion, because it could also have been level mismatch (most likely) or another difference. very cool of you to test it out, though.
SG
gedlee said:Nonlinearity will change the RMS levels of a signal, but this is one of the confounding factors in any test.
I could post a pure third order distortion that was almost 50% and wouldn't be audible.
I for one would be very interested in taking that test.
/Peter
For those willing to experiment, try Keith Howard's Distortion simulator, which seems to be a properly written piece of software.
http://www.audiosignal.co.uk/freeware.html
- Klaus
http://www.audiosignal.co.uk/freeware.html
- Klaus
That's why plain ABX is not the correct test method. Unfortunately, even if the samples were RMS level-matched it's not going to be much better, since RMS level-matching doesn't guarantee percieved equal loudness.scott wurcer said:A quick check of those sample files show an almost 3dB average rms amplitude difference. Either the ABX tool fixes this or the test is totally invalid. I can't believe the folks that claim to have invented it fail to notice this.
IMHO, the only way to go is to truly randomize the files (so you don't know which is which) and then listen to them independently, at any listening level or any other listening conditions one wants to choose. And then tell which was the (more) distorted one, in perception. Of course someone (in this case something -- the computer) has to track things to make the analysis. That's exactly how I do this kind of tests.
-Klaus
KSTR said:Unfortunately, even if the samples were RMS level-matched it's not going to be much better, since RMS level-matching doesn't guarantee percieved equal loudness.
IMHO, the only way to go is to truly randomize the files (so you don't know which is which) and then listen to them independently, at any listening level or any other listening conditions one wants to choose. And then tell which was the (more) distorted one, in perception. Of course someone (in this case something -- the computer) has to track things to make the analysis. That's exactly how I do this kind of tests.
-Klaus
Klaus
That is exactly correct, the distorted signal will have a lower RMS level - if its pure third - because it lowers the peak values of the signal. But a 3 dB difference is excessive if it was only supposed to be 10%. At 10% THD there should be almost no RMS difference as this is a very small amount of distortion in dB terms.
Randomizing as you said is exactly how we did our test, but we used an undistorted reference and listeners were asked to compare the distorted to the undistorted in terms of how much difference they perceived.
smellygas said:
That's pretty interesting. I'm actually surprised that there was a 3dB RMS difference, as Scott Wurcer pointed out (good pickup). I would have expected any ABX site to control for level - it's pretty basic.
Just pointing out that with that methodology the level difference is too obvious, all the major proponents are careful about that. I'm not a particular fan of ABX since the most sincere users multi-band equalize the two sources also.
Last night I ran the two signals through "diffmaker" and the distortion looked more like harsh clipping than a smooth third order. I agree with the doctor, a simple out = in - A*in^3 where the peak distortion is 10% would not change the rms level much and I'd bet it was not very audible.
10% clipping would sound awful.
Thats the thing, people make all kinds of claims as to what is audible and what is not, but don't do the tests right. There is a vast difference between a pure third order nonlinearity and clipping, but yet the claim was "3rd order". This is exactly how the disinformation gets spread.
Thats the thing, people make all kinds of claims as to what is audible and what is not, but don't do the tests right. There is a vast difference between a pure third order nonlinearity and clipping, but yet the claim was "3rd order". This is exactly how the disinformation gets spread.
- Status
- Not open for further replies.
- Home
- Loudspeakers
- Multi-Way
- How much tweeter distortion is audible?