It works just like every other tachometer does. Does the tach on your car engine tell you the number or magnitude of small pertubations in the engine's speed?
of course not.
but it also does not show anything other than a crude approximation of the rpm. how it is implemented in the computer or even in an old school electronic tach determines what time frame it integrates. It certainly does not show "trends" except as you perceive it by looking at the gauge over time.
What do you consider "incredible" accuracy? Do you have any specs or model numbers I could look up? Are they contact type encoders? I tried to stay away from anything that would affect the speed through contact and most of these encoders would make monitoring the speed during disc play impossible or impractical.
Look into the positioners used for the semiconductor industry.
Incredible accuracy.
Optical is non-contact by definition.
Turntable speed analysis part II - pink fish media
There's a part one somewhere. Drop PaulR a pm its his software.
There's a part one somewhere. Drop PaulR a pm its his software.
of course not.
but it also does not show anything other than a crude approximation of the rpm. how it is implemented in the computer or even in an old school electronic tach determines what time frame it integrates. It certainly does not show "trends" except as you perceive it by looking at the gauge over time.
Perhaps the automotive tach was a bad example. I don't really think of my solution as crude.
Let me put it another way:
My device operates on the same basic principle as the Sutherland Timeline except it gives a reading instead of just a fast/slow indication. It does this at less than ¼ the cost and with >10x the accuracy. I also don't have to run around the room looking for a dimly lit spot on the wall, or take measurements by taping a scale to the wall and using a stopwatch and a calculator to come up with meaningful data.
At less than the price of a KAB strobe, I get the same additional benefits as listed above, WHILE I listen to the music and I have the added capabilities of logging my results on a computer and controlling a digital PSU to much greater accuracy that if it were free running.
Did you have some specific sensors in mind? I thought this blog was to discuss DIY ideas for audio. Generalizations aren't much help....
So far, sq225917 is the only one that has provided any useful feedback.
Last edited:
Turntable speed analysis part II - pink fish media
There's a part one somewhere. Drop PaulR a pm its his software.
Thanks for the link and info!
Sorry if I was a bit terse... optical encoder wheels are sold by various vendors. Since you don't need near angstrom accuracy a merely standard encoder wheel should suffice. I'd have to search just like you would to find an encoder suitable for a specific application.
From your pictures and description it seemed to me that you had just a digital readout?
I suppose if you log it with a computer then you have data that can be viewed or analyzed for drift over time. I'm not familiar with the Sutherland Timeline product.
From your pictures and description it seemed to me that you had just a digital readout?
I suppose if you log it with a computer then you have data that can be viewed or analyzed for drift over time. I'm not familiar with the Sutherland Timeline product.
Here's part one:
Turntable speed analysis - pink fish media
The first few pages are missing images, but explanation of the polar plots is in post #47.
Turntable speed analysis - pink fish media
The first few pages are missing images, but explanation of the polar plots is in post #47.
Last edited:
Hello Pyramid
Have you looked into using Hall Effect devices for contactless sensing?
Allegromicrosystems and others make digital and analog sensors of this type.
I am using them in my servo tone arm.
Sincerely,
Ralf
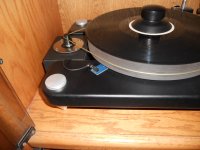
FYI, I'm using a mirrored surface on the outside edge of the platter with an LED emitter/detector pair as the sensor.
Have you looked into using Hall Effect devices for contactless sensing?
Allegromicrosystems and others make digital and analog sensors of this type.
I am using them in my servo tone arm.
Sincerely,
Ralf
Turntable speed control
Thanks for the comment. I thought about using hall effect transistors and a small rare earth magnet on the platter. It would probably be easier than the emitter/detector pair and a little less obnoxious looking than a ¼" x ½" piece of mirror on the platter. I never tried it, I was concerned about the trigger point being too ambiguous; with the strobe output on my device, I could certainly look at it to see how consistent the trigger point is. As in one of my previous posts, the trigger has to be within ~0.5MILs to maintain the desired resolution. I'll have to give that a try.....
I'm also looking at optical imaging chips, VD5377 from ST Micro and ADNS-3050 from Pixart Industries. Both mfrs provide lens assemblies to go with the device, but they are built on the premise they will be used in mice and have a very limited depth of field, ~2.4mm max although the surface to lens spacing is closer to 6mm. I would have to construct my own lens assembly to handle the greater depth. The imaging chips would also provide more real time data.
Have you looked into using Hall Effect devices for contactless sensing?
Allegromicrosystems and others make digital and analog sensors of this type.
I am using them in my servo tone arm.
Sincerely,
Ralf
Thanks for the comment. I thought about using hall effect transistors and a small rare earth magnet on the platter. It would probably be easier than the emitter/detector pair and a little less obnoxious looking than a ¼" x ½" piece of mirror on the platter. I never tried it, I was concerned about the trigger point being too ambiguous; with the strobe output on my device, I could certainly look at it to see how consistent the trigger point is. As in one of my previous posts, the trigger has to be within ~0.5MILs to maintain the desired resolution. I'll have to give that a try.....
I'm also looking at optical imaging chips, VD5377 from ST Micro and ADNS-3050 from Pixart Industries. Both mfrs provide lens assemblies to go with the device, but they are built on the premise they will be used in mice and have a very limited depth of field, ~2.4mm max although the surface to lens spacing is closer to 6mm. I would have to construct my own lens assembly to handle the greater depth. The imaging chips would also provide more real time data.
Turntable speed control
sq225917-I've been grappling with several questions regarding the two displays you posted several days ago, perhaps you can help clarify for me:
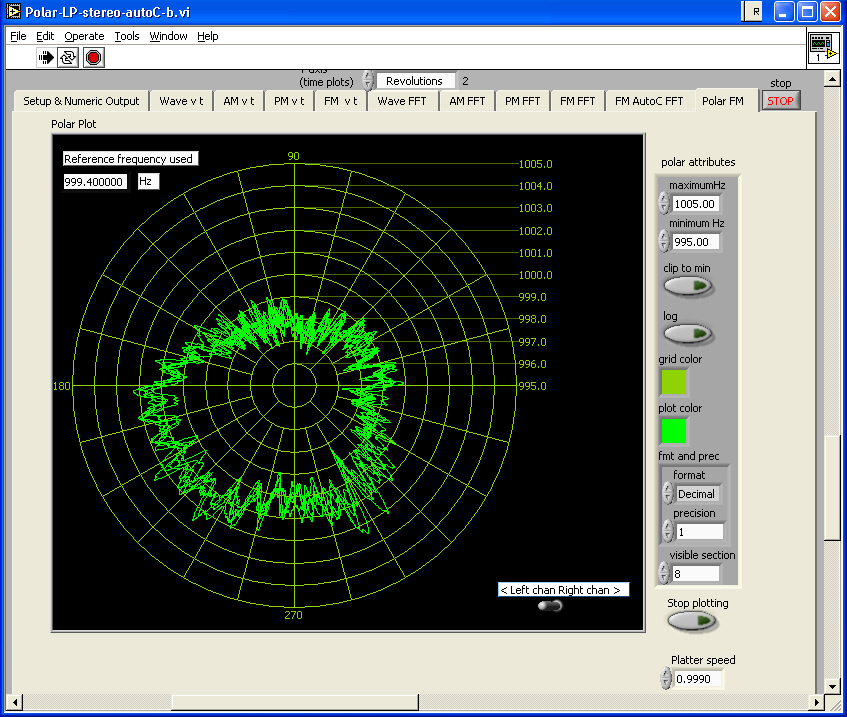
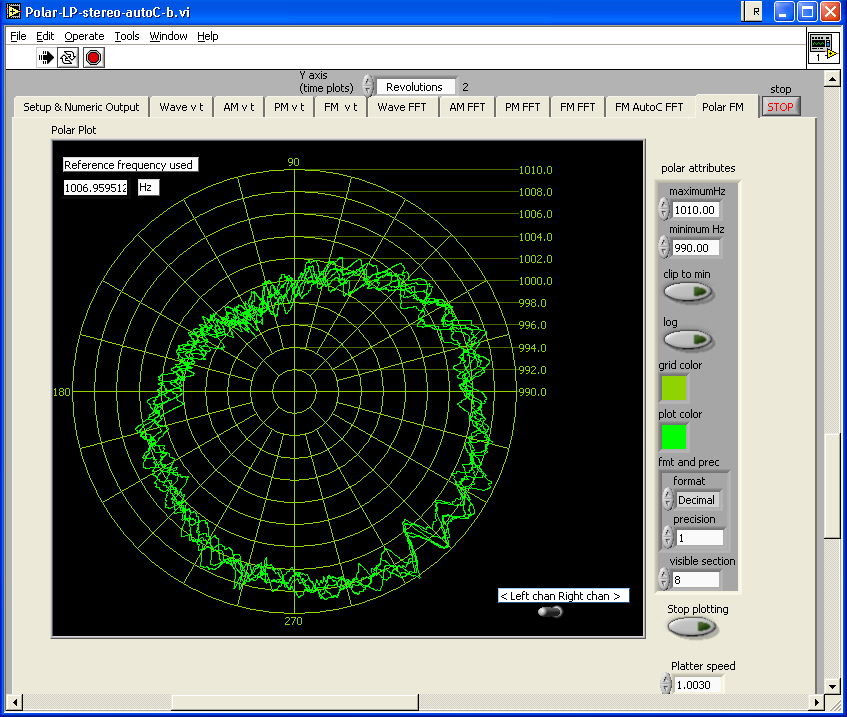
The top display is in the time domain and the lower one in the frequency domain, correct? Are there dimensions to the reading, that is, is the scale on the side indicative of phase modulation in degrees? With the circle in the middle, it's hard for me to interpret. It's hard for me to imagine how a massive platter could be accelerated/decelerated nearly instantaneously as the top display seems to indicate. I guess I could understand deceleration coming from an outside source like motor cogging or bearings, but where would the energy come from to accelerate the platter back on speed in such a short span?
When I look at the lower display and see readings with discrete spectra, it led me to wonder if the discriminator is seeing multiple tones rather than a FM or PM single tone. I'm familiar with analog discriminators but I assume this is being done digitally and I am not familiar with that mechanism or if it broadband enough to have those symptoms.
Back to the displays, you identified the 20 Hz component in the bottom display as possible bearing noise. I wonder how much of the response in either display is produced by warpage in the disc, off center operation (disc not tightly fitting on the spindle) or outside sources of noise being detected and possibly mixing in the cartridge?
You seemed fairly knowledgeable on the subject; any thoughts?
sq225917-I've been grappling with several questions regarding the two displays you posted several days ago, perhaps you can help clarify for me:
The top display is in the time domain and the lower one in the frequency domain, correct? Are there dimensions to the reading, that is, is the scale on the side indicative of phase modulation in degrees? With the circle in the middle, it's hard for me to interpret. It's hard for me to imagine how a massive platter could be accelerated/decelerated nearly instantaneously as the top display seems to indicate. I guess I could understand deceleration coming from an outside source like motor cogging or bearings, but where would the energy come from to accelerate the platter back on speed in such a short span?
When I look at the lower display and see readings with discrete spectra, it led me to wonder if the discriminator is seeing multiple tones rather than a FM or PM single tone. I'm familiar with analog discriminators but I assume this is being done digitally and I am not familiar with that mechanism or if it broadband enough to have those symptoms.
Back to the displays, you identified the 20 Hz component in the bottom display as possible bearing noise. I wonder how much of the response in either display is produced by warpage in the disc, off center operation (disc not tightly fitting on the spindle) or outside sources of noise being detected and possibly mixing in the cartridge?
You seemed fairly knowledgeable on the subject; any thoughts?
I'm not SQ, but in recent days I've read through most of that first Turntable Speed Analysis thread. Explanations of the graphs appear to be scattered throughout it.sq225917-I've been grappling with several questions regarding the two displays you posted several days ago, perhaps you can help clarify for me:
I think your confusion is from the nonstandard display of speed that this display indicates. It's more like a radar display than a conventional rectangular plot. Imagine a perfect circle on top of nearly-circular lines on the display. This would be a perfect turntable running at exactly 33 1/3 RPM (and of a test record cut on a perfect lathe running at exactly 33 1/3 RPM). The deviations are changes from this speed. The graph is circular, rather than rectangular. Time goes clockwise (or countetclockwise), at one revolution per time around the circle. The red trace has five red lines, and is of five rotations of a turntable. The green is likewise five times, but of a different recording, of the table modified or of a different table. The scale is about one percent - if the speed dropped by one percent, the line at that point would go all the way to the center of the circle. If it increased by one percent, it would go out to twice the circle's radius from the center. From this scale it's apparent that the speed variations of these turntables are on the order of 0.1 percent.The top display is in the time domain and the lower one in the frequency domain, correct? Are there dimensions to the reading, that is, is the scale on the side indicative of phase modulation in degrees? With the circle in the middle, it's hard for me to interpret. It's hard for me to imagine how a massive platter could be accelerated/decelerated nearly instantaneously as the top display seems to indicate. I guess I could understand deceleration coming from an outside source like motor cogging or bearings, but where would the energy come from to accelerate the platter back on speed in such a short span?
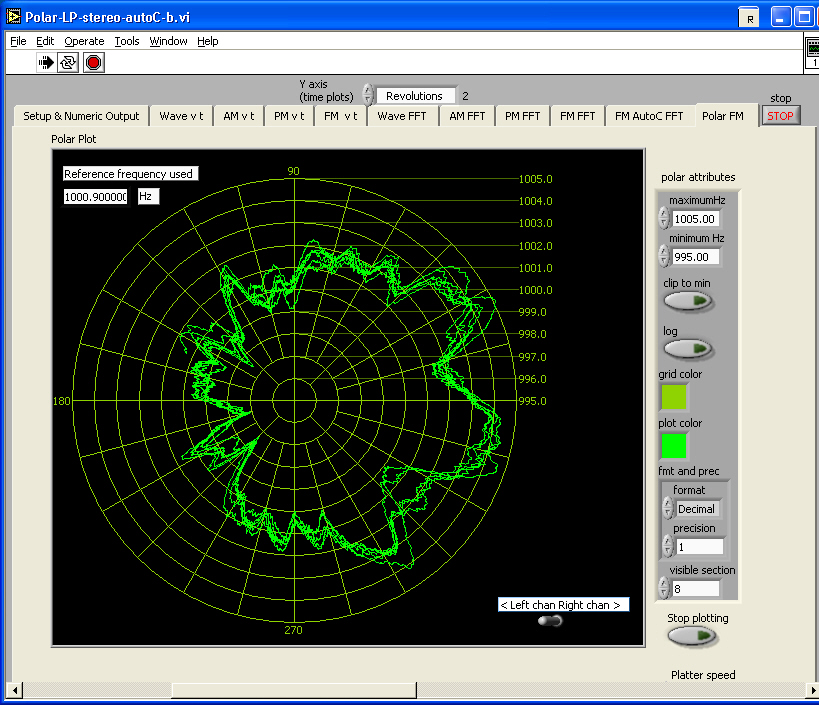
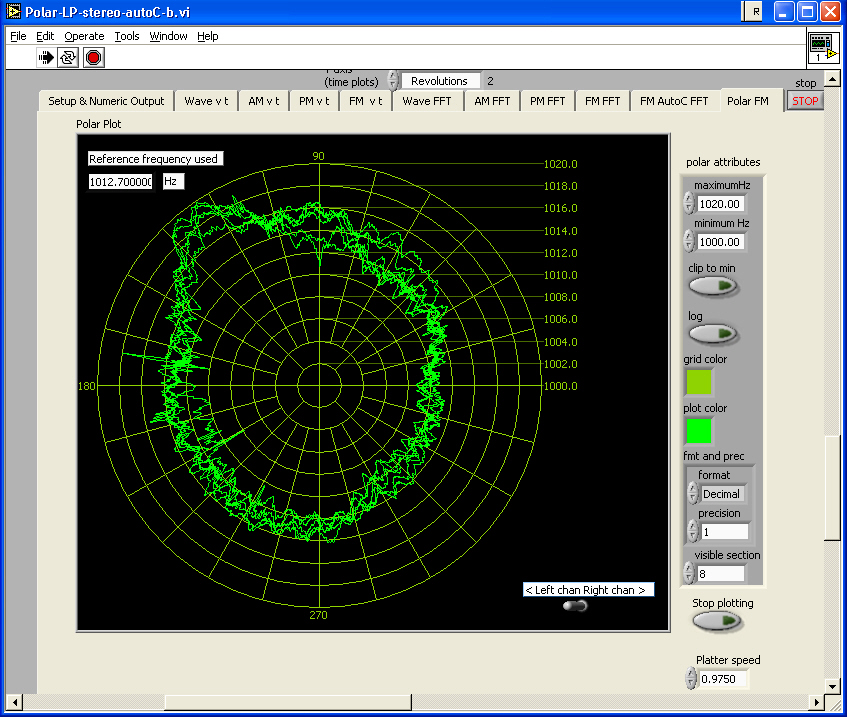
For reference, here's the graph of a 3.5 kHz tone (or whatever the frequency is of the test record they're using), digitally generated and frequency modulated with the two frequencies given (a little over 6 Hz) with 1 percent peak-to-peak modulation:
pink fish media - View Single Post - Turntable speed analysis
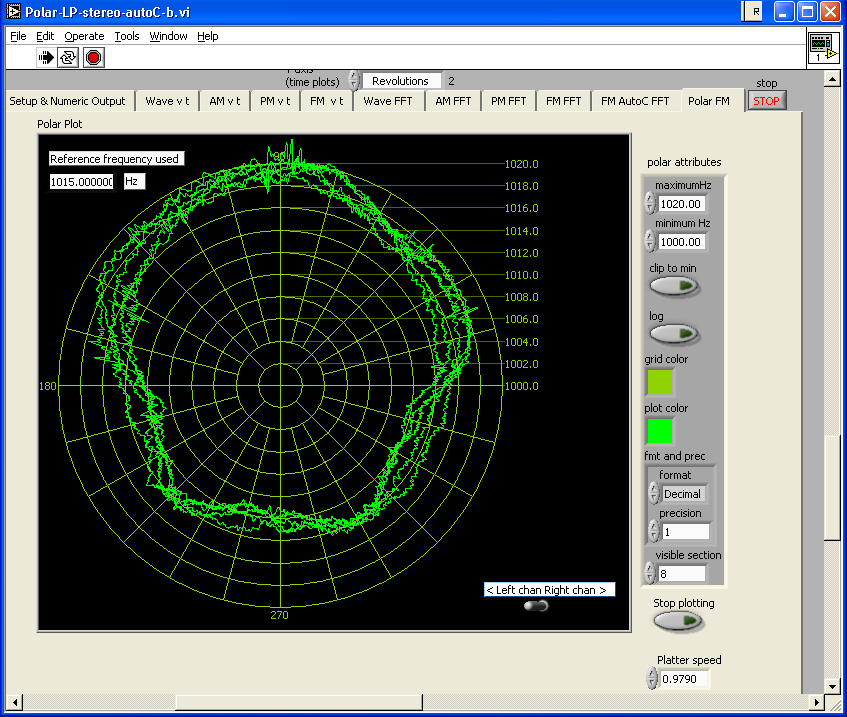
and this one is likewise modulated, but with only 0.1 percent:
pink fish media - View Single Post - Turntable speed analysis
I'm not totally sure about the lower display - it appears to be FFT, and done with the same data used for the first graph (effectively the output of the frequency detection code, so it tells the frequencies of the VARIATIONS in rotation speed - if an idler runs at 5 revs per second and were offcenter so that is modulates the speed, you'd see a clear 5Hz signal going across)- the vertical axis is frequency, the horizontal is time (in units of platter rotation at 33 1/3 RPM), and the color of each point is, I presume, related to intensity of the frequency at that point in time. I find the color thing hard to follow, though, as it's not clear to me how to map between color and intensity.When I look at the lower display and see readings with discrete spectra, it led me to wonder if the discriminator is seeing multiple tones rather than a FM or PM single tone. I'm familiar with analog discriminators but I assume this is being done digitally and I am not familiar with that mechanism or if it broadband enough to have those symptoms.
Turntable speed analysis
Benb-
Thanks for your response. I grasped the basic idea of the top display, just wasn't sure about the scale. If it is 1% as you state, that helps clarify...Thanks.
I believe you are right about the bottom display. Since it shows more than one rev, it uses color/intensity to show amplitude of the frequency components. A normal spectrum (or network) analyzer would show it differently, but it would also show only one sweep; this display shows a continuous sweep over several revs.
The question still remains if the sprectral analysis is showing multiple tones or FM/PM of a single tone. On a normal spectrum analyzer, FM/PM displays as the spreading of a single peak (carrier). This almost displays as multiple tones, thus my question as to the nature of the signals detected and whether the display is more than an indication of speed stability as much as noise and vibration as well.
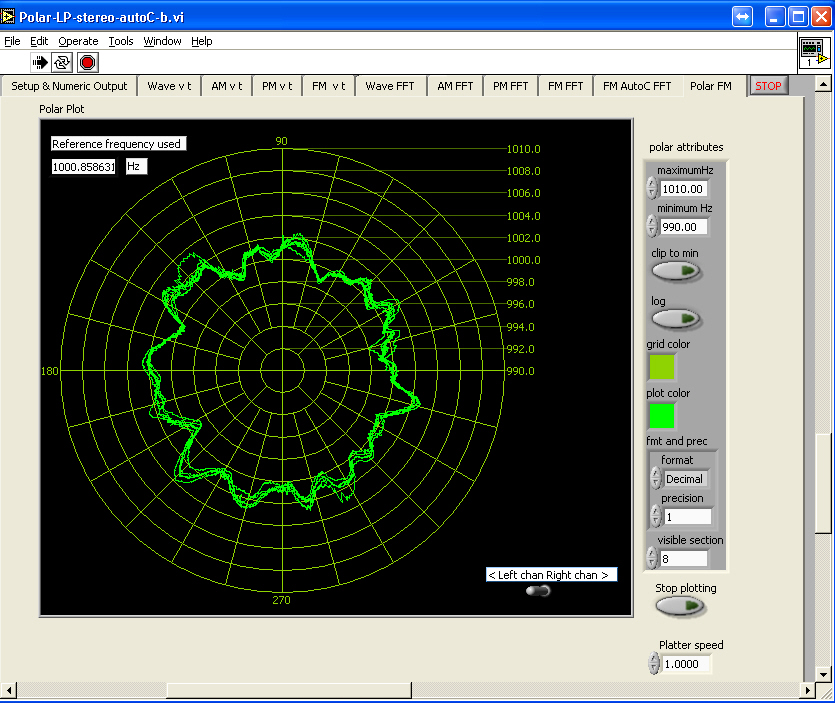
Pyramid, most of what Ben says is correct, where he's wrong is the scaling of the top graph. The 0.1% and 1% examples that he links to are not at the same scale as my graph. My deck actually measures out at .02%.
The 2nd graph is a wavelet analysis where the spectral distribution of energy is given across a nominal set of frequencies. It shows speed deviation in terms of increases or decreases in energy at a particular frequency. It's FFT derived.
On a perfect deck there should be nothing below the test track tone frequency, any energy at a specific frequency can analysed with respect to the fucntion of the deck, ie pulley noise will show up at whatever the mutliples of the pulley size/platter size are etc etc.
These two graphs do tell you absolutely everything you could wish to know about the speed stability of your deck except how many fractions of a second it is fast or slow per revolution.
..and some spectra to go with the above.
I don't remember the precise details of the program after ~10yrs. but I used an autocorrelation function on the demodulated FM, and plotted with the X-axis in units of harmonics of the turntable revolution frequency.
Auto C tt plots - a set on Flickr
I don't remember the precise details of the program after ~10yrs. but I used an autocorrelation function on the demodulated FM, and plotted with the X-axis in units of harmonics of the turntable revolution frequency.
Auto C tt plots - a set on Flickr
Turn Table Speed Control
I spun some new sensor PCBs with a Hall Effect device that fits rather nicely under the platter and the performance is as good if not better than the optical sensor. Another nice benefit, I can leave the sensor powered up and detect when the platter begins to spin, so now the tach goes to sleep after 5 min of inactivity and automatically comes back to life when the platter moves.
Have you looked into using Hall Effect devices for contactless sensing?
Allegromicrosystems and others make digital and analog sensors of this type.
I am using them in my servo tone arm.
Sincerely,
Ralf
I spun some new sensor PCBs with a Hall Effect device that fits rather nicely under the platter and the performance is as good if not better than the optical sensor. Another nice benefit, I can leave the sensor powered up and detect when the platter begins to spin, so now the tach goes to sleep after 5 min of inactivity and automatically comes back to life when the platter moves.
Attachments
I've thought a bit about turntable speed sensing (other than the methods discussed so far).
To get better "high-frequency" resolution (better than 0.555...Hz at 33 1/3 RPM), there must be measurements many more times than once per revolution. Many platters offer this naturally with the strobe patterns on the side (or underneath, as in the Dual 1229). I calculate the 33 1/3, 60Hz band as having the highest resolution with 216 dots or squares (120Hz for neon light output divided by 0.555...Hz), or 432 transitions per revolution. I'm thinking this should provide adequate resolution (even a lightweight platter should provide a reasonably steady speed for 1/432 of a revolution from its flywheel effect). These transitions can be picked up with light using the light focused from an LED or even a small solid-state laser (think hand-held laser pointer), and the light picked up with a phototransistor or (for better timing and more accurate transitions) a photodiode.
Even if the spacings of these marks are not perfect, or the transitions are not exactly 50 percent duty cycle, these can be measured with a microcontroller to accuracy of a microsecond (or substantially less, depending on hardware timers available). If you put such a platter on a large, heavily weighted platter with a low-friction bearing that when spun does not slow down much (I recall a DIYaudio post with links to a two-part Youtube video of a platter spun fast that took around 15 minutes to slow to a stop), you can measure the exact time of each transition and store it for all 432 transitions (one might want to add an extra "index" transition to make it easy for the software to find the start). This (the 432 transition times) can be stored in the microcontroller's non-volatile (FLASH) memory, and compared to the transitions generated by an operating turntable, giving an accurate speed compared to a reference at the rate of 432 times per second. With careful math, one could measure the transitions of several revolutions and compensate for the decaying speed.
Another idea, using a platter with a flat cylindrical rim, put a circumference of magnetic tape on the outside of the rim, and have a tape head placed close enough to the rim to pick up a tone recorded on the tape. A higher frequency tone would require the tape head be closer to pick it up. The tape would have the wow and flutter of the recorder used to record the tone on the tape, but this could be compensated for by reading the timings of the tone's zero crossings while "calibrating" the platter on a heavy turning platter as above.
Last edited:
VPI turntable motors
Does anyone know what the specs are for the VPI turntable motors that run from the mains (line) voltage. For example, I assume the 240VAC versions for non-US use are also 50 Hz, but do they spin at 600 RPM? Do the turntables use the same pulley ratios as in the US (13.3333:1 for 45 RPM and 18:1 for 33.33333 RPM)?
Does anyone know what the specs are for the VPI turntable motors that run from the mains (line) voltage. For example, I assume the 240VAC versions for non-US use are also 50 Hz, but do they spin at 600 RPM? Do the turntables use the same pulley ratios as in the US (13.3333:1 for 45 RPM and 18:1 for 33.33333 RPM)?
- Home
- Source & Line
- Analogue Source
- The Official Turntable Drive System/Motor Thread!