I measured in my living room. The gate is set long enough
to get a general idea of what the response is. But the lower you go, the less accurate, due to reflections.
I measured at -10dB from the maximum output on my amp. Its about 50 watts, so thats probably around 95dB
Patrick Bateman:
I have a real hard time understanding your plots. I couldn't tell what I was looking at until Weltersys pointed out that HD exceeded 100%. The labels are too small for my old eyes, there are no colors to distinguish the lines, there are no legends, etc... If you could, please download REW and use it for your measurments - or make the plots clearer. Take for example this plot from one of my speakers.
Thanks,
X
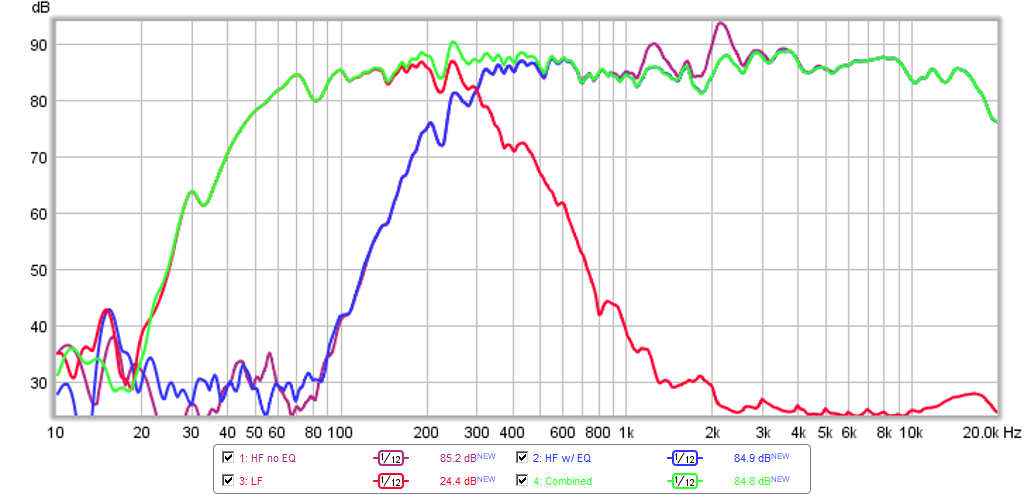
Easy to read axis, use of colors to symbolize different things, legends, easy to understand. ..
Guys, whether or not that speaker has a lot of distortion, his measurement pic is from Holm, which graphs THD relative to 0dB, not relative to the FR plot. Also, the big peaks (and most of the smaller ones) would most likely line up with reflection nulls if the raw response graph was shown instead of gated.
In room distortion level rising 20+ dB above the fundamental frequencies, well over 100% distortion, around 5 watts producing only 95 dB is, IMHO, effing pathetic.
I can sing 20 dB (four times) louder than that. A speaker that can't even reproduce the level of a single human voice without gross distortion should IMHO be relegated to background music use in a portable picnic pack-away stereo. But of course, as long as you like the way it sounds, MHO makes no difference
By the way, the maximum output of an amplifier occurs when it is driven in to hard clipping, causing harmonic distortion. Are you sure the amp was not clipping?
Art
It's measured in my living room.
Take the low frequency measurements with a grain of salt.
I wish I had the luxury of measuring outdoors, but San Diego is freaken expensive. HOA won't look kindly on me setting up outside, and besides that, there's so many cars coming and going, noise pollution would ruin the measurements 80% of the time.
TLDR: Until I move, my measurements below 250hz will not be reliable.
Patrick Bateman:
I have a real hard time understanding your plots. I couldn't tell what I was looking at until Weltersys pointed out that HD exceeded 100%. The labels are too small for my old eyes, there are no colors to distinguish the lines, there are no legends, etc... If you could, please download REW and use it for your measurments - or make the plots clearer. Take for example this plot from one of my speakers.
Thanks,
X
Easy to read axis, use of colors to symbolize different things, legends, easy to understand. ..
In my experience, nothing produces a better and more reliable measurement than HOLM.
I used Arta for years, until I discovered that it "scales" measurements for some unknown-fing-reason. (Really frustrating; it makes me doubt the legitimacy of all measurements performed with ARTA.)
HOLM is the third program I've used for measurements, and while it's graphing is ugly, the quality of it's measurements is superb.
In my experience all the popular programs produce the same results with equivalent settings. I have no idea what you're referring to with ARTA. Anyway, the program is fine, the graph is fine, but the gating is a sort of worst compromise because you can't really see the in-room bass, but you can't see mid-high range clearly either, so there isn't a lot you can say about the speaker.
Like I said, if it were ungated, you'd probably see a null at the major distortion peak, explaining the ~-6dB distortion reading, although it's probably somewhat high down there anyway.
Like I said, if it were ungated, you'd probably see a null at the major distortion peak, explaining the ~-6dB distortion reading, although it's probably somewhat high down there anyway.
In my experience all the popular programs produce the same results with equivalent settings. I have no idea what you're referring to with ARTA. Anyway, the program is fine, the graph is fine, but the gating is a sort of worst compromise because you can't really see the in-room bass, but you can't see mid-high range clearly either, so there isn't a lot you can say about the speaker.
Like I said, if it were ungated, you'd probably see a null at the major distortion peak, explaining the ~-6dB distortion reading, although it's probably somewhat high down there anyway.
Here's the strange thing that Arta does, that screws up the measurements:
It seems to "normalize" the graph.
Here's an example:
A few months ago I built a horn sub. In order to evaluate the horn sub, I also measured a vented sub that I had. Arta showed that the horn sub had no output advantage
This made no sense, as hornresp predicted an efficiency advantage of 10+ dB, and the horn sub SOUNDED louder.
After banging my head against the wall for days on that, I measured with HOLM, and HOLM showed exactly what Hornresp showed:
An efficiency advantage of about 10dB for the horn.
So Arta is "normalizing" the measurement, for some unknown reason. I've read through the manual, haven't been able to find a way to turn this "feature" off. It also makes me wonder if polar measurements with Arta are reliable. (IE, if the output off-axis is down by six decibels, will Arta's stupid "normalization" feature normalize the off axis graph?
Well FWIW, ARTA definitely is not and has not ever done that for me. If you want me to try to reproduce it, just let me know how you're using it (I've got a mic right here and can just run measurements of one the desktop speakers whenever, easy peasy). If I just run a normal FR measurement how I always do and then change the level (completely outside the computer setup so equivalent to changing speakers), the difference in level is accurate.
Well FWIW, ARTA definitely is not and has not ever done that for me. If you want me to try to reproduce it, just let me know how you're using it (I've got a mic right here and can just run measurements of one the desktop speakers whenever, easy peasy).
To replicate it, simply measure a sealed box and a horn.
When I do it with Arta, it shows that their output levels are basically identical.
It appears to be normalizing the peak of the graph.
You can't replicate this by simply measuring the same speaker at different voltage levels, because the normalization appears to be base on the PEAKS. Arta seems to be graphing things so that the peak of the measurement is always the same. (IE, normalization.)
I don't think your reasoning makes sense as to why changing the speaker level wouldn't be equivalent but no matter, here is a measurement on the tweeter axis from pretty close (yellow), and then the same with me holding up a piece-of-paper horn (green). The woofer output is included, so you see it go down with the horn blocking it, but no levels or settings were changed.
Attachments
I have used both Holmimpulse and REW and find REW just as accurate and way easier to use and more powerful feature set. The ability to plot as many traces on same graph for a polar is valuable. You may be dealing with having ARTA plot relative vs absolute calibrated mic.
I'll check it out. The limitation of just three measurements on HOLM is maddening.
Did you realize you can have unlimited measurements in a set, but only see three at a time? You probably did, but I didn't for a long time (until I saw Geddes' polarmap measurement instructions, actually).  I still like ARTA and REW better, but I don't care at all 90% of the time.
I still like ARTA and REW better, but I don't care at all 90% of the time.Did you realize you can have unlimited measurements in a set, but only see three at a time? You probably did, but I didn't for a long time (until I saw Geddes' polarmap measurement instructions, actually).
I didn't know that! Thank you.
Cookiemonster,
You are the man! Very nice simulation.
This is the first 3d BEM (FEA) I have seen of a Paraline. Great work!
I have to step up to ABEC3 one of these days. I have SW too.
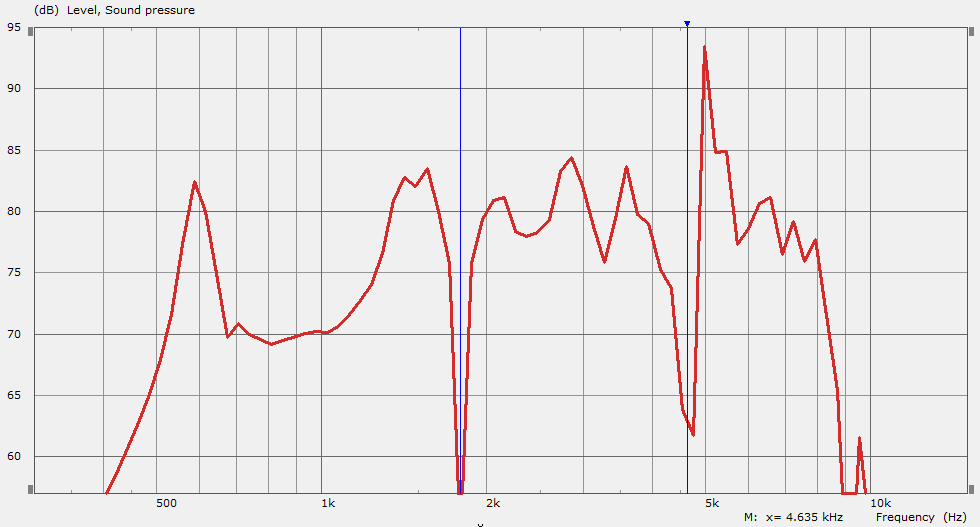
Here is a 1d Akabak model of my Paraline (a little different but same concept of flat folded channels) from Post 759 or so. I got some really ratty looking response curves too:
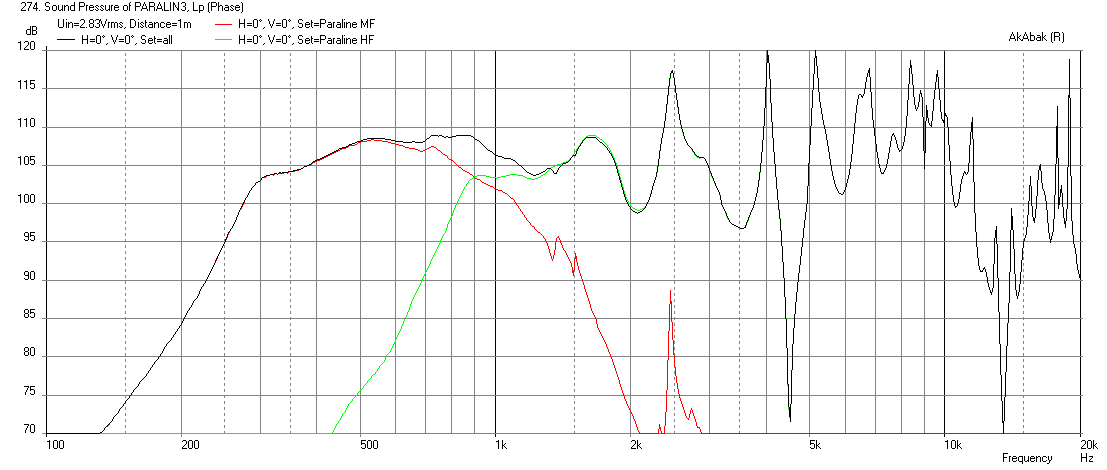
Looks kind of similar to your 24hr sim:
Thanks! ABEC3 is really powerful, and looks like it can do a lot. But it´s clearly garbage in, garbage out, as always.
I´m waiting for a Synergy horn simulation now, 5000Hz mesh frequency, 2gb memory, nearly 24 hours this time too. Will post the results somewhere else I suppose. (Suitable mids thread probably). Don´t be scared by the time it takes - it´s only the BEM part that takes long to solve. In the Synergy example, I have the taps, CD entry and horn itself in BEM, the rest in LEM. Once the BEM part is solved, you can run changes in the LEM portion and that solves very quickly.
On the OPLUG (Linkwitz) user group, I posted some sims of the LX521 baffle and V bass bin (in a members-only section though), trying to match it to the measured results by SL. Not quite there yet, and it probably never will be (non-linearities etc), but it seems very useful for dipole models too.
Dive in!
Did I mention it´s pretty unforgiving? Had mistakenly used the same handle from the BEM model to LEM twice (same ID). No warning given until I ran the LEM script.
Well, i also learned something. Imported mesh files, with smooth surfaces (and therefore a very small element size in the mesh) force very high resolution of the solver. So I simplified the Quadratic Throat Waveguide, and now it runs at acceptable speeds. Something to keep in mind.
Well, i also learned something. Imported mesh files, with smooth surfaces (and therefore a very small element size in the mesh) force very high resolution of the solver. So I simplified the Quadratic Throat Waveguide, and now it runs at acceptable speeds.
Something to keep in mind. Hello Guys
After reading tons of interesting posts here I bump up this thread from sleep just to ask one question.
Is there any conclusion about purposefulness of internal 45 degree reflectors along paraline spacer layer(s) - on 180 degree bent?
There are two schools of thought: some people think of this as a ray tracing like optical reflections off mirrors, some like me, say it is all pressure waves and can be modeled with 1d lumped element models and that 45deg or 0d reflectors won't much difference.
I'll add a third way of looking at this. This involves pressure waves and reflection, diffraction and reversion waves. Sharp corners and short wavelengths are a real problem with these designs, it is obvious when you look at the outputs from the many designs that have been proposed.
Considering that in this case "reflector" is considerably smaller than wavelength reflector does not make too much sense.. than again this is true only when we observe just one dimension of wave-guide so I believe that reflector may help to improve paraline device by a bit.
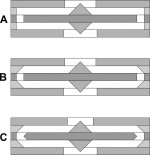
There are some of my brief observations and sketch of three examples:
A. Original, straight cut paraline element without reflectors - only pressure wave approach. Due to pretty long "vertical" area exposed in one dimension of wave propagation .. higher possibility of partial reflections/cancelations within paraline device
B. Huygen's approach - Corner reflectors (chamfered edge of spacer layers) - reduced passage area on each turn (possible effect of "choking" - low pass filter effect)
C. Combined approach to justify booth worlds and avoid possible negative effect of each.
..so chamfered edge of spacer layers + chamfered edge of eyeshape-center wafer. Huygen's full area "optical" reflection is possible but without area reduction.
From "pressure wave" point of view there is constant cross section area through 180 degree turn (I believe,.with even less unevenness than in original A. example)
..any thoughts, critics, observations.. WELCOME
Attachments
- Home
- Loudspeakers
- Multi-Way
- Square Pegs