I have a couple of questions on the plot posted by De Oc:
Q1.)
Post1434 shows the 0degrees in the middle of the right axis. Normally we see this middle point labelled as 90degrees or 180degrees and we have to do a bit of arithmetic to arrive at the Phase Margin (PM). But in De Oc's plot it looks like the plot is already scaled to read off Phase Margin.
What has been done to allow this direct reading of PM?
Q2.)
It looks to me that this amplifier has a low open loop gain.
If we set the closed loop gain to ~+24dB, then that level would cross the OLG curve @ ~ 20kHz.
Does that mean that there is no excess gain @ 20kHz and thus no negative feedback @ 20kHz to reduce distortions?
Last edited:
I have a couple of questions on the plot posted by De Oc:
Q2.)
It looks to me that this amplifier has a low open loop gain.
If we set the closed loop gain to ~+24dB, then that level would cross the OLG curve @ ~ 20kHz.
Does that mean that there is no excess gain @ 20kHz and thus no negative feedback @ 20kHz to reduce distortions?
The gain plot is not "open loop gain", but "loop gain", i.e. the gain around the loop, when the loop is closed at all frequencies. Disturbances are attenuated by this loop gain. To attenuate distortions of a 20 kHz sinewave requires decent loop gain at the harmonics, i.e. 40, 60, 80 etc. kHz.
I would have expected a higher unity gain frequency, and the gain curve does look somewhat odd for a hifi amp. Could this be an opamp or IC amplifier since the low frequency gain is ~60dB.
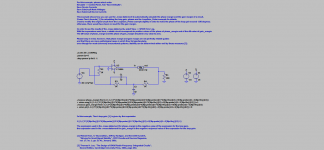
The schematic says it's a mod of a Toshiba amplifier. Can't see the top half of the schematic so can't really say why the low-frequency gain is limited. The high-frequency gain plot (for gains above ULGF) is not "correct" as the loop gain is measured using just a voltage source in the feedback loop, instead of a Tian or Middlebrook probe which use a current injection also.
I would have expected a higher unity gain frequency, and the gain curve does look somewhat odd for a hifi amp. Could this be an opamp or IC amplifier since the low frequency gain is ~60dB.
Hi John,
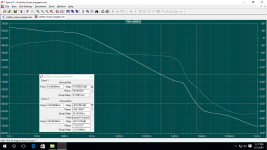
If you are referring to post #1434 [per AndrewT query above], it was derive from an old bootstrap design of Toshiba [Aurex SBA-50]. The plot was the result following the example on LTSpice audioamp.asc tutorial. Attached was another approach following a discussion from another "plotting phase margin thread" by forum members, [dadod, neutrality, bonsai & others]
If I understood Sir Bob Cordell correctly, left image cursor 1 is at 0db and it corresponds to 96deg. To calculate -180-96=84deg [84deg being the phase margin] . To validate, the amp has a closed loop gain of 35db then dragging the cursor to find 35db in the graph and 35db corresponds to -86deg.
Finding the gain margin, left image 2nd cursor falls at 360deg and it corresponds to -40db. To calculate, -40db minus closed loop gain and that should be -40-35=5db gain margin.
Correct me if I'm wrong.[non technical mind here
") and still getting the grip of it]
and still getting the grip of it]Sa muli,
Albert
Attachments
Last edited:
The schematic says it's a mod of a Toshiba amplifier. Can't see the top half of the schematic so can't really say why the low-frequency gain is limited. The high-frequency gain plot (for gains above ULGF) is not "correct" as the loop gain is measured using just a voltage source in the feedback loop, instead of a Tian or Middlebrook probe which use a current injection also.
Hi,
I thought to find the phase margin and gain margin the plot has to be "loop gain" not closed loop gain and not open loop gain -Middlebrook' Tian probe method. I think I learned it from member bonsai.
Regards,
Albert
Hi,
I thought to find the phase margin and gain margin the plot has to be "loop gain" not closed loop gain and not open loop gain
Yes, this is correct.
However, what is not helping your understanding here is that many people erroneously refer to "loop gain" as "open loop gain" (including some of the LTspice examples).
Middlebrook and Tian both measure the required "loop gain" property, with subtle differences that do not matter in the context of audio power amplifiers.
The high-frequency gain plot (for gains above ULGF)
sorry, that should of course be "(for frequencies above ULGF)"
I have a couple of questions on the plot posted by De Oc:
Q1.)
Post1434 shows the 0degrees in the middle of the right axis. Normally we see this middle point labelled as 90degrees or 180degrees and we have to do a bit of arithmetic to arrive at the Phase Margin (PM). But in De Oc's plot it looks like the plot is already scaled to read off Phase Margin.
What has been done to allow this direct reading of PM?
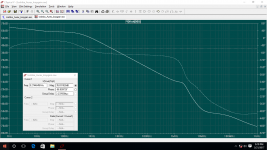
Interesting! I opened up my LTSpice and been able to do it this way:
(1) Untick the "unravel branch wrap" on the phase plot. This makes the 0 degree in the middle of the right axis.
(2) Manually change the top scale of the left axis (equal to the lower limit) so the 0 dB is also in the middle of the axis.
(3) Save the plot setting may be???
For "normal" way to get direct reading is this (of course):
Plotting Loop Gain Using the Tian Method - Spring 2011
Attachments
Last edited:
Yes, this is correct.
However, what is not helping your understanding here is that many people erroneously refer to "loop gain" as "open loop gain" (including some of the LTspice examples).
Middlebrook and Tian both measure the required "loop gain" property, with subtle differences that do not matter in the context of audio power amplifiers.
I see your point here, guess I need to scan back the thread, below was member andy_c's teaching it does involve the Middlebrook Tian probe. There is one LTSpice method that actually uses .measure directive [no plotting of graphs needed] but finding the correct variables is too hard for me.
"So, to sum up:
1) Look at AOLB = loop gain = -1/(1-1/(2*(I(Vi)@1*V(x)@2-V(x)@1*I(Vi)@2)+V(x)@1+I(Vi)@2)) to analyze stability.
2) Find the frequency for which AOLB is 0 dB. This is the unity loop gain frequency.
3) Find the phase shift of AOLB (call it phi) at the unity loop gain frequency.
4) Compute the phase margin from phase_margin = phi - (-180)
...from andy_c
Hmmm..something is not right, I think I have dragged the cursor a little over 35db, phase falls at 86deg instead..
When you do it with that trick of aligning 0 dB with 0 degree, make sure you plot "v(out)/v(fb)" instead of the normal "-v(out)/v(fb)". Otherwise you are looking at the phase at the LF or left side of the positive gain side (if not careful).
Last edited:
Q2.)
It looks to me that this amplifier has a low open loop gain.
Can anyone explain why a low loop gain should be "wrong"? Look at it as "potential". Isn't it better if you can utilize all (optimum amount) of your available potential?
When you do it with that trick of aligning 0 dB with 0 degree, make sure you plot "v(out)/v(fb)" instead of the normal "-v(out)/v(fb)". Otherwise you are looking at the phase at the LF or left side of the positive gain side (if not careful).

...and for those who want to do simulation exercises of the loopgain to find the phase and gain margin, here are the LTSpice examples. I know this has been dealt with before but it seems most threads end up hanging.. and for beginners who bites huge chunks and get choked [that was me
] .Sa muli,
Albert
Attachments
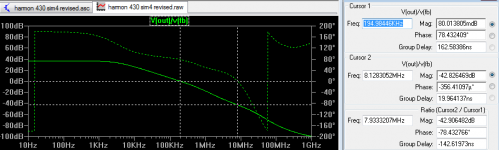
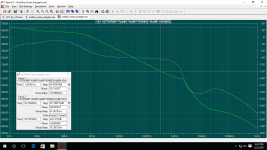
Ok I think I got it sorted now. Following andy_c's teaching, here's what I got from my Aurex mod amp.
OLG = 64.45dB
ULGF = 314.79KHz
-96° - (-180°) = 84° PM
Method was Middlebrook Tian probe. According to andy_c it takes into account all impedance interaction. Gain margin cannot be calculated here as 360° does not correspond to 0dB.
Does not seem to be very good figures but anyway...
OLG = 64.45dB
ULGF = 314.79KHz
-96° - (-180°) = 84° PM
Method was Middlebrook Tian probe. According to andy_c it takes into account all impedance interaction. Gain margin cannot be calculated here as 360° does not correspond to 0dB.
Does not seem to be very good figures but anyway...
Attachments
I am more confused.The gain plot is not "open loop gain", but "loop gain", i.e. the gain around the loop, when the loop is closed at all frequencies. Disturbances are attenuated by this loop gain. To attenuate distortions of a 20 kHz sinewave requires decent loop gain at the harmonics, i.e. 40, 60, 80 etc. kHz.
your explanation makes sense if that plot is indeed a loop gain version.
But the subsequent posts including the quote from Tian seem to be swapping back and forth between loop gain and open loop gain.
How can I tell the difference when an experimenter shows a plot?
Am I right to say:
Open loop gain - Closed loop gain = feedback ratio?
And feedback ratio = loop gain?
Ok I think I got it sorted now. Following andy_c's teaching, here's what I got from my Aurex mod amp.
OLG = 64.45dB
ULGF = 314.79KHz
-96° - (-180°) = 84° PM
Method was Middlebrook Tian probe. According to andy_c it takes into account all impedance interaction. Gain margin cannot be calculated here as 360° does not correspond to 0dB.
Does not seem to be very good figures but anyway...
Allow me to clear myself, after seeing how the more experienced simulators do it, gain margin can actually be plotted. Dragging cursor 1 lower to find 180° phase [via plot window and not aligning with the reference phase no. in the graph] and the corresponding dB is the gain margin. In my plot it was -12dB.
Hope I've done it clearly now, sorry about this.
Sa muli,
Albert
Last edited:
That sounds right if the plot is showing Open Loop Gain.
Allow me to clear myself, after seeing how the more experienced simulators do it, gain margin can actually be plotted. Dragging cursor 1 lower to find 180° phase [via plot window and not aligning with the reference phase no. in the graph] and the corresponding dB is the gain margin. In my plot it was -12dB.
Hope I've done it clearly now, sorry about this.
Sa muli,
Albert
I'm not sure the same method gives the same answer if the plot is showing Loop Gain.
For Phase Margin, because the Open Loop Gain and the Loop Gain both cross the 0dB level at the same frequency, they both give the same answer when reading off the phase at that crossing frequency.
That sounds right if the plot is showing Open Loop Gain.
I'm not sure the same method gives the same answer if the plot is showing Loop Gain.
For Phase Margin, because the Open Loop Gain and the Loop Gain both cross the 0dB level at the same frequency, they both give the same answer when reading off the phase at that crossing frequency.
They seem to correlate with each other, the "loop gain" and the "open loop gain" method [Middlebrook Tian probe] According to Andy_c the Middlebrook method is loop gain on a more accurate level. Dadod I think have made plot comparions that also includes Bob Cordell's method, with an added inductor placed in the feedback loop.
I do think the more experienced ones are using the Middlebrook because it does not need more work to change in the circuit. It can be easily deactivated via .param directive and the injected voltage and current probe will no longer interfere when doing other sim runs.
- Home
- Design & Build
- Software Tools
- Spice simulation