Solved: Left 2nd harmonic is known higher at 192Ksps
Hey thank you for making the measurements! That confirms it.
Well I've learned the reason the left channel is showing up that way.") I've been in touch with QA this morning and they say it is the result of the higher 192Ksps sample rate. I had forgotten that the "unboxing" photos I did were all at the 48Ksps, 32K window, and -16dBV they specify in the "getting started" instructions. All my recent testing has been at 192Ksps, 64K window, and higher -10dBV / -1dBV / +3dBV levels.
I've been in touch with QA this morning and they say it is the result of the higher 192Ksps sample rate. I had forgotten that the "unboxing" photos I did were all at the 48Ksps, 32K window, and -16dBV they specify in the "getting started" instructions. All my recent testing has been at 192Ksps, 64K window, and higher -10dBV / -1dBV / +3dBV levels.
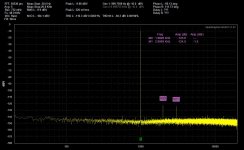
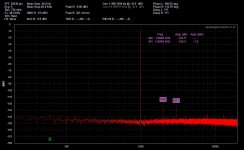
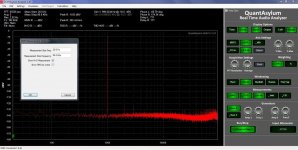
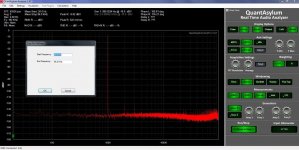
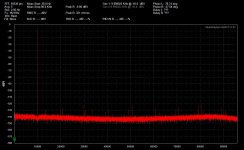
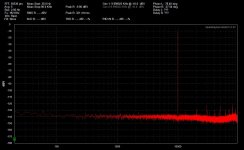
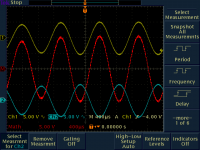
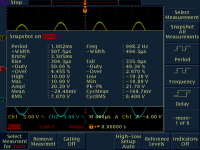
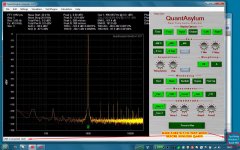
Sure enough, the sample rate makes the difference. Below is the same -10dBV level and same 64K window, but now 48Ksps. The left channel 2nd harmonic is now around -123.0dBV (down from -117dBV 192Ksps) and the right channel 2nd is nearby at -124.5dBV. I tried changing the window size from 32K to 64K and back but that didn't make much of a difference.
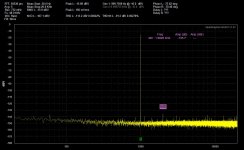
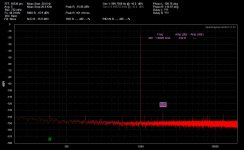
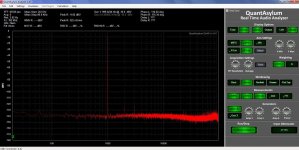
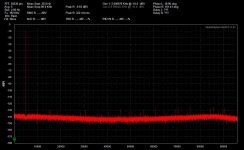
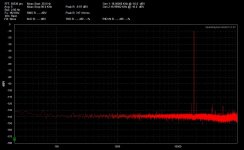
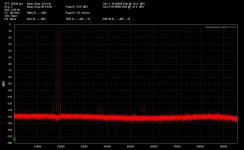
Then in the next two shots I've reduced the level from the -10dBV down to -16dBV. The 2nd drops further on both channels and the 3rd harmonic nearly disappears.
QA says this is known behavior on their end and why they didn't implement the 384Ksps rate they originally intended to do. They recommend the 48Ksps rate. I'm OK with that. 48K is fine and if I do want to measure at 192Ksps I can just use the right channel, which is measuring quite well at 192Ksps. For only $420 I can't complain.
Also good to know I didn't fry the box somehow! QA says damage is very unlikely due to their new input protections.
It seems my QA401 has the exact same behavior, using the same setting as yours, the left channel loopback gives 2H/3H of -118.6/-126.3dBV, whereas the right channel loopback gives 2H/3H of -123.1/-125.3dBV.
Hey thank you for making the measurements! That confirms it.
Well I've learned the reason the left channel is showing up that way.
I've been in touch with QA this morning and they say it is the result of the higher 192Ksps sample rate. I had forgotten that the "unboxing" photos I did were all at the 48Ksps, 32K window, and -16dBV they specify in the "getting started" instructions. All my recent testing has been at 192Ksps, 64K window, and higher -10dBV / -1dBV / +3dBV levels.Sure enough, the sample rate makes the difference. Below is the same -10dBV level and same 64K window, but now 48Ksps. The left channel 2nd harmonic is now around -123.0dBV (down from -117dBV 192Ksps) and the right channel 2nd is nearby at -124.5dBV. I tried changing the window size from 32K to 64K and back but that didn't make much of a difference.
Then in the next two shots I've reduced the level from the -10dBV down to -16dBV. The 2nd drops further on both channels and the 3rd harmonic nearly disappears.
QA says this is known behavior on their end and why they didn't implement the 384Ksps rate they originally intended to do. They recommend the 48Ksps rate. I'm OK with that. 48K is fine and if I do want to measure at 192Ksps I can just use the right channel, which is measuring quite well at 192Ksps. For only $420 I can't complain.
Also good to know I didn't fry the box somehow! QA says damage is very unlikely due to their new input protections.
Attachments
-
 left 48Ksps window 65536 1KHz avg 5 -10dBV +out_in loopback.jpg150.3 KB · Views: 402
 -
 rightt 48Ksps window 65536 1KHz avg 5 -10dBV +out_in loopback.jpg143.4 KB · Views: 400
 -
 left 48Ksps window 65536 1KHz avg 5 -16dBV +out_in loopback.jpg148.5 KB · Views: 403
 -
 rightt 48Ksps window 65536 1KHz avg 5 -16dBV +out_in loopback.jpg141.4 KB · Views: 394
Last edited:
I received my 401 and I like it very much.... even if the residual thd were to be no better, the higher input level/protection and better ground isolation is a major improvement in usability. The diff I/O is also a plus when needed.
Your thd+n is 110dB and spec is 108dB. Very good.
THx-RNMarsh
Your thd+n is 110dB and spec is 108dB. Very good.
THx-RNMarsh
Last edited:
Hey thank you for making the measurements! That confirms it.
Well I've learned the reason the left channel is showing up that way.
Sure enough, the sample rate makes the difference. Below is the same -10dBV level and same 64K window, but now 48Ksps. The left channel 2nd harmonic is now around -123.0dBV (down from -117dBV 192Ksps) and the right channel 2nd is nearby at -124.5dBV. I tried changing the window size from 32K to 64K and back but that didn't make much of a difference.
Then in the next two shots I've reduced the level from the -10dBV down to -16dBV. The 2nd drops further on both channels and the 3rd harmonic nearly disappears.
QA says this is known behavior on their end and why they didn't implement the 384Ksps rate they originally intended to do. They recommend the 48Ksps rate. I'm OK with that. 48K is fine and if I do want to measure at 192Ksps I can just use the right channel, which is measuring quite well at 192Ksps. For only $420 I can't complain.
Also good to know I didn't fry the box somehow! QA says damage is very unlikely due to their new input protections.
If you sample at 192, will the QA401 show harmonics up to 96kHz? This would allow us to get almost to THD-20 with harmonics out to the 5th. Can you try a back-to-back on that?
Also, try a back-to-back of CCIF IM at 18+19kHz with 48kHz sampling.
HF THD and IM is far more interesting than 1kHz.
Cheers,
Bob
If you sample at 192, will the QA401 show harmonics up to 96kHz? This would allow us to get almost to THD-20 with harmonics out to the 5th. Can you try a back-to-back on that?
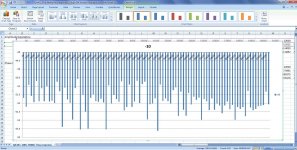
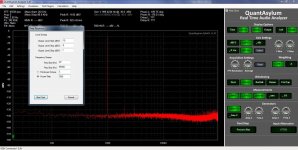
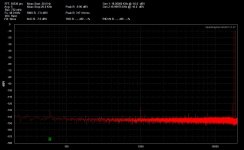
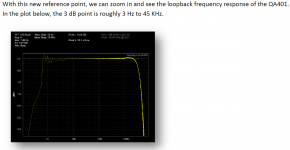
Looks like it does, if I'm looking at these right! In the plots below I've expanded the log and linear axis from the 20Hz - 20KHZ default to 20Hz - 96KHz. The QA401 parameters are set at the 192Ksps, 65K window and -10dBV. The unit is in loopback on the right channel, since that is apparently the "good" channel at 192Ksps.
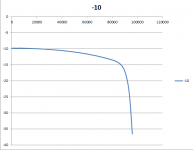
* I was curious about the frequency response before starting the tests. So the first is the QA401 frequency response plug-in setup going from 20Hz to 96KHz in 1KHz steps and the second plot is the results. Looks bad at first, but Excel has it scaled so the entire vertical axis just goes from -49dBV to -53dBV and the variation goes from -50.5 to -53.5. It is actually fairly flat if I'm looking at the correctly.
A note of caution to anyone doing frequency response tests on the QA401: the (V1.47 here) software does not reset the generator parameters back to where they started! If you look at your generator at the end the params will be whatever the freq response test stepping ended with.
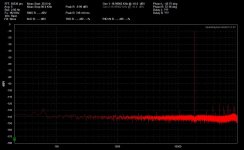
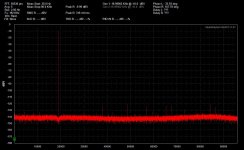
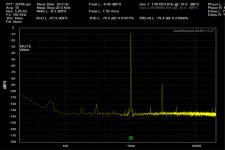
* The next two are log and linear plots with the tone at 19KHz. I can see the harmonics at 38KHz, 57KHz, but 76KHz & 95KHz are gone. I'm assuming those missing two highest harmonics are a "real" lack of harmonics and not an analyzer deficiency up there since I'm seeing other harmonics at 84KHz and 87KHz (appears to be working up there).
* The next two are log and linear plots with the tone at 10KHz. I can see the 20KHz & 30KHz harmonics with the higher ones gone again.
* Next is a 5Khz tone just to pick something more or less random out of curiosity.
* Next is a 1KHz tone as a double-check that nothing has changed.
The 2nd and 3rd are still where they were in the posts above for the 192Ksps and the right QA401 channel.* The last two are the setup screens for changing the axis and THD measurements to 96KHz from 20KHz, for anyone wanting to try replicating these on their QA401's.
Attachments
-
 freq response 192Ksps 10Hz 96KHz 1Khz.jpg214.4 KB · Views: 150
 -
 freq response 192Ksps 10Hz 96KHz 1Khz steps setup.jpg213.5 KB · Views: 386
 -
 192Ksps 65K window 20Hz to 96KHz 19KHz tone avg 5 log plot.jpg143.5 KB · Views: 155
 -
 192Ksps 65K window 20Hz to 96KHz 19KHz tone avg 5 linear plot.jpg162.5 KB · Views: 124
 -
 192Ksps 65K window 20Hz to 96KHz 1KHz tone avg 5 THD_setup.jpg211.7 KB · Views: 98
 -
 192Ksps 65K window 20Hz to 96KHz 1KHz tone avg 5 axis_setup.jpg209.4 KB · Views: 95
 -
 192Ksps 65K window 20Hz to 96KHz 1KHz tone avg 5.jpg217.1 KB · Views: 90
 -
 192Ksps 65K window 20Hz to 96KHz 5KHz tone avg 5 linear plot.jpg162.9 KB · Views: 100
 -
 192Ksps 65K window 20Hz to 96KHz 10KHz tone avg 5 linear plot.jpg162 KB · Views: 100
 -
 192Ksps 65K window 20Hz to 96KHz 10KHz tone avg 5 log plot.jpg142.8 KB · Views: 105
Last edited:
Also, try a back-to-back of CCIF IM at 18+19kHz with 48kHz sampling.
And here are the IMD tests.
* The first with a 192Ksps sample rate, 65K window, and -10dBV in loopback on the right channel. One log and one linear plot with the 18KHz and 19KHz tones, to get a good look at both the tone harmonics and IMD products.
* The last is now back to a 48Ksps sampling rate, 65K window, and -10dBV with 20Hz to 20KHz axis and test limits, and the 18KHz and 19KHz tones.
Interesting that I can see the 1KHz IMD mix tone at 48Ksps in the third plot, but I can't at the 192Ksps rate in the first plot. I'm not sure why.
So here is a question I've been meaning to ask: why does the noise floor "bow up" slightly from 70KHz to 96KHz? In the log plot it looks more like a ripple that starts at about 20KHz. I've seen that in other plots at times. Is it just the apparent thing of the amp circuits in the analyer having that slightly guassian shapped noise increase between the two frequencies? Is that a common thing to see on anayzers and/or amp circuits?
Keep in mind that clicking on the arrows at the lower left corner of any of these plots will zoom them up.
Attachments
Last edited:
The noise floor going up at higher frequencies is from the noise shaping in the ADC. This ADC can sample at up to 768KHz but is still optimized for 20 KHz bandpass. The AK5394A is the only Delta Sigma ADC I know that pushes the corner to a much higher frequency (80 KHz or so). The AK5494A is also significantly more expensive. The DAC (ak4490) in the QA401 is really good, possibly better performance than the ADC in the QA401.
...* I was curious about the frequency response before starting the tests. So the first is the QA401 frequency response plug-in setup going from 20Hz to 96KHz in 1KHz steps and the second plot is the results. Looks bad at first, but Excel has it scaled so the entire vertical axis just goes from -49dBV to -53dBV and the variation goes from -50.5 to -53.5. It is actually fairly flat if I'm looking at the correctly...
Attached the loopback frequency response of my QA401 (measured with the plugin), it is not quite as flat as yours. But it seems to resemble the FR given by the QA401 user manual (p.48).
Attachments
And here are the IMD tests.
* The first with a 192Ksps sample rate, 65K window, and -10dBV in loopback on the right channel. One log and one linear plot with the 18KHz and 19KHz tones, to get a good look at both the tone harmonics and IMD products.
* The last is now back to a 48Ksps sampling rate, 65K window, and -10dBV with 20Hz to 20KHz axis and test limits, and the 18KHz and 19KHz tones.
Interesting that I can see the 1KHz IMD mix tone at 48Ksps in the third plot, but I can't at the 192Ksps rate in the first plot. I'm not sure why.
So here is a question I've been meaning to ask: why does the noise floor "bow up" slightly from 70KHz to 96KHz? In the log plot it looks more like a ripple that starts at about 20KHz. I've seen that in other plots at times. Is it just the apparent thing of the amp circuits in the analyer having that slightly guassian shapped noise increase between the two frequencies? Is that a common thing to see on anayzers and/or amp circuits?
Keep in mind that clicking on the arrows at the lower left corner of any of these plots will zoom them up.
Nice work! Thanks.
Cheers,
Bob
The noise floor going up at higher frequencies is from the noise shaping in the ADC.
Interesting! Thank you for the post. I'm out of date on what is being done with ADCs these days. I had to go back just now and review noise shaping from way back when.
So essentially algorithms to push the noise generated by error from quantization and dithering from a specified passband up to higher frequencies. Pretty slick! That does explain why the change in noise floor started after 20KHz.
Last edited:
Attached the loopback frequency response of my QA401 (measured with the plugin), it is not quite as flat as yours. But it seems to resemble the FR given by the QA401 user manual (p.48).
I'm glad you did the test! That frequency response diagram in the "getting started" guide is what was rattling around in my head, given that it appears to show an upper corner frequency of just 50KHz or so. I was rather surprised that my run didn't show a corner even at 96KHz. Yours is showing a corner around 85KHz.
Hmmm..... I'm suspicious of my loopback frequency response results, given those of QA's. Either I've made a mistake or QA increased the bandwidth of something inside the unit since their guide was published. If there is a corner at 45KHz that would explain why the 4th and 5th harmonics of 19KHz were missing in action. The response of the unit just dropped off up there. The curve you traced would have killed off the 5th harmonic, but some of the 4th should remain unless the system just happens to have a low 4th to start with, which it might.
Last edited:
If you would like a frame of reference from an analog audio generator, I just checked my Krone-Hite 4402B: Typical harmonic level.... 4KHz at 1v rms thru atten and output amplifier into 100K load: Gen output to ShibaSoku 725D and its monitor output to a QA401: -136 and -138dBv for 2H and 3H.

THx-RNMarsh
THx-RNMarsh
heh, remote desktop from a Mac to a Ubuntu 16.04 box (Intel NUC) running Windows 10 in a VirtualBox VM

I've attempted my first differential measurements. How should the peak L be interpreted, across OutL+ and OutL-? I tried to answer that below.
Also, assuming it's across the difference of the outputs, why the discrepancy between 7.07rms and 7.5Vrms? Perhaps inaccuracies in the attenuator?
Also, when using the higher sampling frequencies (Fs) the output seems to go a bit nuts periodically. I just rehit the "reset average button" and it goes back to normal, but it's a bit annoying. This doesn't happen at the lower Fs.
Attachments
Also, when using the higher sampling frequencies (Fs) the output seems to go a bit nuts periodically. I just rehit the "reset average button" and it goes back to normal, but it's a bit annoying. This doesn't happen at the lower Fs.
I've noticed that! Sort of like pushing the "reset" button but the noise floor jumps up about 40dBV and (very) slowly settles back down. I do the same thing, hit the "reset" button when it happens to shorten the settling time. I've been assuming it was doing occasional resets for reasons I didn't know about, but maybe that is a bug. I've found myself "hurrying up" to take screenshots before it happened again. I also hadn't noticed yet about it not happening at the lower sample rate. I haven't done that much stuff yet at the 48Ksps.
Just curious - what are you using for a differential probe? I haven't tried differential measurments yet, but I figured I would probably use coax-to-aligator clip leads, then just use the "hot" center coax lead/clip out of each lead.
BTW great work on the mac/linux/VM networking!
So far I've only run mine on a vanilla PC running Windows 7 x64.
Last edited:
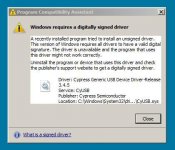
It seems a number of people, myself included, are having issues with the QA 400 usb driver, CyUSB.sys, where the supplied digital signature cannot be verified successfully on Win7x64 OS installations resulting in no communications between the QA400 software front end and the hardware box on the end of the usb cable.
Unfortunately, with the less than stellar after sales support from the manufacturer, I've had to find my own solution to this problem, which I did via the Cypress Semiconductor forums, they being the authors of the usb driver for which the offending digital certificate is issued by QA.
Via this link at Cypress...
CyUSB.sys digital signature cannot be verified on windows7 64-bit OS | Cypress
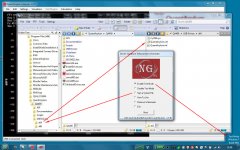
...I found this Driver Signature Enforcement Overrider software...
Driver Signature Enforcement Overrider 1.3b
...which I've now been running successfully for a few days on a Lenovo X201 with a fresh Win7x64 Sp1 OS installation and the QA 400 Analyser v1.227 software + usb driver.
Hth.
Unfortunately, with the less than stellar after sales support from the manufacturer, I've had to find my own solution to this problem, which I did via the Cypress Semiconductor forums, they being the authors of the usb driver for which the offending digital certificate is issued by QA.
Via this link at Cypress...
CyUSB.sys digital signature cannot be verified on windows7 64-bit OS | Cypress
...I found this Driver Signature Enforcement Overrider software...
Driver Signature Enforcement Overrider 1.3b
...which I've now been running successfully for a few days on a Lenovo X201 with a fresh Win7x64 Sp1 OS installation and the QA 400 Analyser v1.227 software + usb driver.
Hth.
Attachments
I hope this is a fine place to post my question...
For basic analysis and testing of single-ended amplifiers, am I better off with the newer QA401 or would I be fine saving some money and searching for the QA400? The price difference is not slight, so that makes me wonder if the performance of the newer model would be considerably better.
For basic analysis and testing of single-ended amplifiers, am I better off with the newer QA401 or would I be fine saving some money and searching for the QA400? The price difference is not slight, so that makes me wonder if the performance of the newer model would be considerably better.
Disable signed driver verification in win8/10
How to Disable Driver Signature Verification on 64-Bit Windows 8.1 or 10 (So That You Can Install Unsigned Drivers)
How to Disable Driver Signature Verification on 64-Bit Windows 8.1 or 10 (So That You Can Install Unsigned Drivers)
Didn't realise there are similar driver issues in later versions of Windows thought it was specific to Vista x64 and Win7 x64.
WinXP x32, btw, works fine...
Didn't realise there are similar driver issues in later versions of Windows thought it was specific to Vista x64 and Win7 x64.
WinXP x32, btw, works fine...
It's not really an issue. It's part of windows security and one can turn it off when needed.
Bigger question is why are the driver not signed as they should be.
- Home
- Design & Build
- Equipment & Tools
- QuantAsylum QA400 and QA401