Some ideas from the measurements:
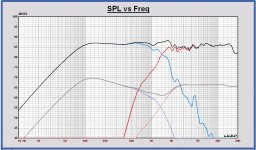
1) Tuning freq should be higher, there is quite a bit of suckout at 100-200Hz region. I think higher tuning would fix this. If I tune it around 45Hz there should be some boost to these freqs. as well.
2) Need to filter the port output somehow, maybe add some foam between woofer and port. Optimally I'd want the midrange bleedthrough be under 30dB to signal level.
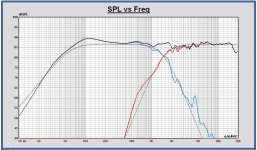
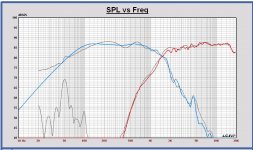
3) At 30cm there is a -5dB notch around 1,8k. At 1m this is fine. What is happening here?
4) Now the top of the impulse responses it at -22us for tweeter and 522us for woofer. This correlates to 18,7cm difference. Would I need to add almost 190mm worth of extra baffles into this to time align these?
1) Tuning freq should be higher, there is quite a bit of suckout at 100-200Hz region. I think higher tuning would fix this. If I tune it around 45Hz there should be some boost to these freqs. as well.
2) Need to filter the port output somehow, maybe add some foam between woofer and port. Optimally I'd want the midrange bleedthrough be under 30dB to signal level.
3) At 30cm there is a -5dB notch around 1,8k. At 1m this is fine. What is happening here?
4) Now the top of the impulse responses it at -22us for tweeter and 522us for woofer. This correlates to 18,7cm difference. Would I need to add almost 190mm worth of extra baffles into this to time align these?
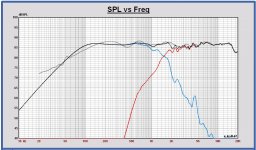
I have simulated also your filter 3. IMO not so good around the crossover, there is some boost.
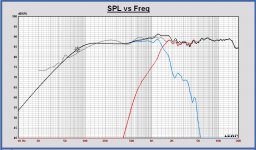
I have compared your measurements with the simulation. Measurements in grey color in the plots.
Good mapping of the separate drivers, but not for the sum.
Probably there is some phase difference between my simulation and the measurement.
I use now a minimum phase transform to get the phase of the driver models. That is rather roughly.
I will try to get the driver phase out of your driver measurements of REW filter2.dat for future simulations. That is more correct.
For my own designs I take the phase of an IEC baffle measurement for the phase of driver models.
There is a strange notch in the woofer measurement at 2.4kHz that is not visible in the driver response. Something parasitic in your filter ?? It also has some impact on the phase of the woofer around the crossover frequency. This can be partly an explanation for the sum difference.
The dip at 1.8kHz is probably due to a different phase between woofer and tweeter. The wavelenght around 1.8kHz is 20cm, so 90 degrees is 5cm.
And at 30cm the drivers are also measured under a little angle.
I will have a look to the basreflex system also.
A question concerning REW. Is it possible to view 2 measurements together in one graph, out of more measurements in the file. I tried to view woofer and tweeter at 1m together in the same graph, but I didn't succeed in that.
I have no explanation for the large difference between the impulse starting times. It seems something has going wrong in your measurement.
Paul
Attachments
Last edited:
I already checked the phase of the driver models with the measurements. That is ok.
I do a minimum phase transform on your driver measurements to get the phase of the models.
Comparing now with the measured phase I see a phase delay in the woofer measurement that corresponds with 30mm.
Almost no delay for the tweeter. That is the acoustical offset that you also measure in that way.
1) Tuning freq should be higher, there is quite a bit of suckout at 100-200Hz region. I think higher tuning would fix this. If I tune it around 45Hz there should be some boost to these freqs. as well.
The port will work one octave above and one third of an octave below the tuning frequency.
Mayuri,
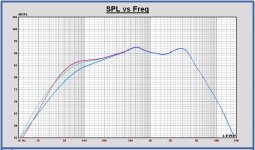
Just looked to the basreflex system.
With 25 L cabinet volume, the tuning frequency fB is better 40 Hz. Then F3 = 50Hz.
For a tuning frequency of 40Hz, you better choose a higher port diameter.
5 cm diameter and 11 cm long or 6 cm diameter and 17cm long.
For this woofer in a cabinet volume of 40 L and fB = 40 Hz, the F3 = 40 Hz (three times 40") ) , a B4 behavior.
) , a B4 behavior.
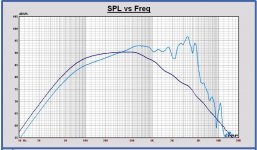
In the plot the simulation of the SPL of the woofer in the filled closed box (blue curve) , a basreflex tuned at 30Hz (green curve) and a basreflex tuned at 40 Hz (red curve)
Just looked to the basreflex system.
With 25 L cabinet volume, the tuning frequency fB is better 40 Hz. Then F3 = 50Hz.
For a tuning frequency of 40Hz, you better choose a higher port diameter.
5 cm diameter and 11 cm long or 6 cm diameter and 17cm long.
For this woofer in a cabinet volume of 40 L and fB = 40 Hz, the F3 = 40 Hz (three times 40
) , a B4 behavior.In the plot the simulation of the SPL of the woofer in the filled closed box (blue curve) , a basreflex tuned at 30Hz (green curve) and a basreflex tuned at 40 Hz (red curve)
Attachments
I looked to the minimum vent area requirement for a basreflex with this Peerless woofer.
Conform R.Small the vent area Sv >= 0.8 * fB * VD with VD = Sd * xmax.
If you fill in the parameters for this driver with fB = 40Hz, the diameter of the vent has to be minimum 71mm.
For fB = 30Hz, this is 62 mm.
If you not respect this minimum diameter, you can have port noise at maximum excursion. This is the statement of R.Small.
For a tuning at 40Hz and a cabinet volume of 25 L, this means a port diameter of 7cm and a length of 24cm.
Seems reasonable, my simulations also confirm this port size. Went and bought 69mm port which I'll cut to lenght. It will substract around 1l from enclosure but I will dampen sides and near port to avoid midrange leakage, which will probably compensate for it.
About the 2,4kHz parasitic, I think it is the alligator clips I use. They are poor quality and add measurable distortion (distortion lowers if I solder all wires vs use clips).
About the 2,4kHz parasitic, I think it is the alligator clips I use. They are poor quality and add measurable distortion (distortion lowers if I solder all wires vs use clips).
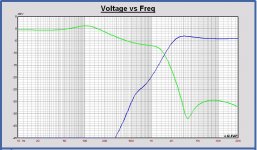
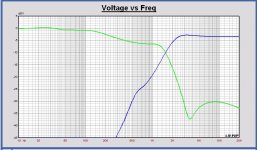
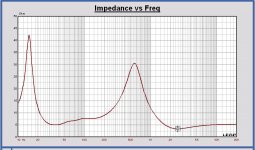
With the basreflex tuned at fB = 40 Hz there is an impedance peak at 70 Hz. The peak value is 60 Ohm with the settings I use for the filling.
This peak has a strong inpact on the filter.
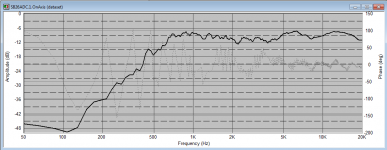
Look to the response of my filter V7 with the basreflex responses for the woofer SPL and impedance. A boost at 100Hz, typical problem of a basreflex system and a passive filter.
So some changes of the filter schematic are needed if a basreflex is used.
I will post a proposal later this evening.
For a final schematic it is best to measure the impedance peaks of the basreflex system.
This peak has a strong inpact on the filter.
Look to the response of my filter V7 with the basreflex responses for the woofer SPL and impedance. A boost at 100Hz, typical problem of a basreflex system and a passive filter.
So some changes of the filter schematic are needed if a basreflex is used.
I will post a proposal later this evening.
For a final schematic it is best to measure the impedance peaks of the basreflex system.
Attachments
Mayuri,
This is a proposal for a passive filter that can be used with the basreflex system.
F3 is 51 Hz. I made the assumption that the impedance peak is 60 Ohm at 70Hz.
Probably some changes have to be made if that impedance value is not the same in your speaker.
Minimum impedance is 3.42 Ohm at 2.5 KHz.
To realize a good result I had tu use E24 component values, like the 3.6 mH and the 13 uF.
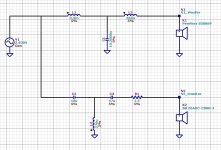
Plots and schematic in attach. The serial resistances of the coils are placed external now to show their values.
This filter is just an example, of course there are other ways to realize a good result.
In your last simulation of your filter 3, the transfer of the woofer filter is different of the one I simulate. It still looks that the woofer impedance is not ok in your simulation.
Paul
This is a proposal for a passive filter that can be used with the basreflex system.
F3 is 51 Hz. I made the assumption that the impedance peak is 60 Ohm at 70Hz.
Probably some changes have to be made if that impedance value is not the same in your speaker.
Minimum impedance is 3.42 Ohm at 2.5 KHz.
To realize a good result I had tu use E24 component values, like the 3.6 mH and the 13 uF.
Plots and schematic in attach. The serial resistances of the coils are placed external now to show their values.
This filter is just an example, of course there are other ways to realize a good result.
In your last simulation of your filter 3, the transfer of the woofer filter is different of the one I simulate. It still looks that the woofer impedance is not ok in your simulation.
Paul
Attachments
-
 Mayuri filter basreflex V8 transfer filter.JPG138.4 KB · Views: 68
 -
 Mayuri filter basreflex V8 Impedance.JPG111.6 KB · Views: 51
 -
 Mayuri filter basreflex V8 phase.JPG180.7 KB · Views: 61
 -
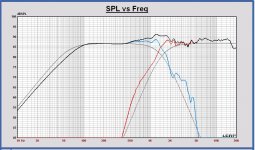
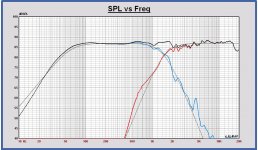 Mayuri filter basreflex V8 SPL.JPG178.2 KB · Views: 101
 -
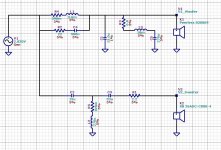 Mayuri filter basreflex V8 schematic.JPG139.4 KB · Views: 117
Paul:
Thanks for the revision. For now I'll try this:
1) Your previous filter (for sealed)
2) Porting, starting from lower tuning and going higher until balance is found.
Qts:
Cabinet is already built. I simulated the tweeter placement for hours and switched between positions. Off-axis tweeter gives better on-axis FR but worse off-axis.
After some trials I couldn't realize the correct SPL shape with the resistor in front of the capacitors. Always too much damping in the 2 to 5 kHz region.What happens if 2R2 is before capacitors, instead of after them?
One should calculate it to compare both concepts.
Crossover parts arrived, and I assembled it + attached to enclosure. Didn't port, still sealed. Now they are completely finished aside from from redoing surface. Final measurements + filter measurements before soldering all parts.
Dropbox - finals.mdat
Dropbox - Pauls filter.mdat
Sounds very good, much better than the filter version scrambled from the components I had at hand. I'll give better impressions later when I'm not suffering from a headache, got a bit of migraine coming on...
Dropbox - finals.mdat
Dropbox - Pauls filter.mdat
Sounds very good, much better than the filter version scrambled from the components I had at hand. I'll give better impressions later when I'm not suffering from a headache, got a bit of migraine coming on...
I've been testing the speakers for 2 weeks now (without migraine), and overall I have been more than happy with the results of this project. The original problem with the full ranges I have was that they lacked on vocals.
The new speakers really excel at vocals. One of the best I have ever heard. Human voices have good nuances and depth. They sound real and beliavable. Level of overall detail is much better than previous speakers. The speakers are still a bit high on treble, and I will probably add a small resistor to bring it down 0,5-1dB. Small changes
Driver integration is good, as you can see from the simulations and measurements they have good phase tracking around the crossover frequency. Nothing much to add here. They simply blend together. The drivers aren't time aligned, but as Stereophiles John Atkinson proved, it doesn't seem to correlate wheter they get good reviews or not.
The 8" nomex midwoofer has increasing 3rd order distortion after 1kHz, and 1,5kHz is probably maximum you should cross them at. This is a limiting factor in crossover design, but If you can work around it, you get an excellent midwoofer with a very friendly sound signature. Easy to listen, but still detailed. Keep in mind I am running them with subs, no comment on low bass.
The SB26ADC is a world class tweeter. I bought this due to Troels' measurements on his page, and they hold true. Simply amazing for the money you pay for it, you can't get better value than this.
Mayuri
Nice project !!. The SB26ADC is a nice piece of tweeter indeed.
For some reason I found it a bit hard to deal with (depend on the baffle shape). Very detailed and smooth sounding. I have matched it with 15cm SB mid-woofer.
Value for money very good.
How is that peerless pairing with it ??
Regards
Nice project !!. The SB26ADC is a nice piece of tweeter indeed.
For some reason I found it a bit hard to deal with (depend on the baffle shape). Very detailed and smooth sounding. I have matched it with 15cm SB mid-woofer.
Value for money very good.
How is that peerless pairing with it ??
Regards
Attachments
Mayuri,
that is good news!
The 1.5kHz crossover frequency is the maximum you might choose, especially if you look also to the power response of this speaker.
In Leap I can do a power response calculation, but only in the assumption that the drivers have a constant piston behavior up to high frequencies.
For your Peerless woofer with the nomex cone, it will smoothly break up and the constant piston behavior will be affected for higher frequencies.
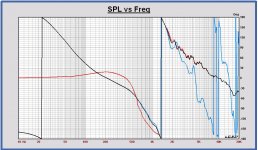
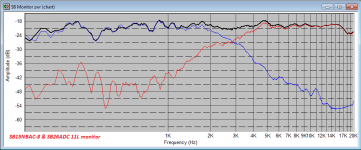
Anyway I simulated the power response with your current filter.
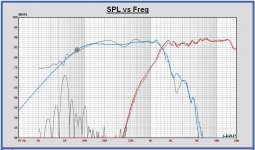
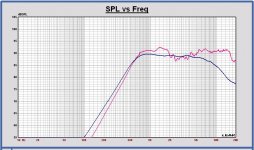
In the first plot you see the SPL and the power responses, the lower curves are the power.
You can see a power sum dip around the crossover frequency.
With your woofer driver this dip will be probably compensated by the smooth cone break up.
To know it exactly the power response of your woofer should be measured.
As an information, in the other plots the unfiltered SPL and calculated power responses of the individual drivers, power in dark blue.
I think it is a good idea to attenuate the tweeter a little and listen for the best result.
that is good news!
The 1.5kHz crossover frequency is the maximum you might choose, especially if you look also to the power response of this speaker.
In Leap I can do a power response calculation, but only in the assumption that the drivers have a constant piston behavior up to high frequencies.
For your Peerless woofer with the nomex cone, it will smoothly break up and the constant piston behavior will be affected for higher frequencies.
Anyway I simulated the power response with your current filter.
In the first plot you see the SPL and the power responses, the lower curves are the power.
You can see a power sum dip around the crossover frequency.
With your woofer driver this dip will be probably compensated by the smooth cone break up.
To know it exactly the power response of your woofer should be measured.
As an information, in the other plots the unfiltered SPL and calculated power responses of the individual drivers, power in dark blue.
I think it is a good idea to attenuate the tweeter a little and listen for the best result.
Attachments
Hello Paul,
This remark in your previous post left me somewhat puzzled:
To know it exactly the power response of your woofer should be measured.
I have always been under the impression power response cannot measured directly, but is calculated from closely spaced on (0 degrees) and off-axis measurements.
How exactly does one measure power response?
Regards,
Eelco
Hi Eelco,
Concerning power response and directivity index of speakers, there is a very interesting presentation by Floyd Toole, it is on YouTube.
Very recommended to listen to the full presentation, because it gives a very clear understanding of the speaker response in a room.
YouTube
There is explained also that you can measure the power response of a speaker by calculating the directivity index of the speaker.
Under the condition that the on axis SPL is flat, the power response is the inverse response of the directivity index, see in the Floyd Toole presentation around minute 35.
The directivity index of a speaker can be calculated by measuring the SPL of the speaker in two globes around the speaker, a horizontal and a vertical one.
This method is very well explained in an article by Joseph G. Tylka.
https://www.princeton.edu/3D3A/Publications/Tylka_3D3A_DICalculation.pdf
I have applied this Tylka method in Leap and calculated the directivity index of a speaker in that way.
So I could also calculate the power of the speaker by reversing the calculated directivity index.
I did see that the power response simulation directly calculated by Leap was very close to this result.
The power response of a speaker can also be measured in professional reverberation rooms.
I don’t know the details of these measurements, but for sure there will be more information about it. I don’t have at this moment.
For my current designs I use the power response simulations of Leap.
I carefully check the constant piston behavior of the driver in its operating range, by comparing the on axis SPL and the power curves.
It already gives me a good idea of the power response as it is very complicated to measure it.
Paul
- Status
- This old topic is closed. If you want to reopen this topic, contact a moderator using the "Report Post" button.
- Home
- Loudspeakers
- Multi-Way
- Peerless 830869 + SB26ADC-04 crossover help?