Loop back IR looks good there, SR looks a bit like its FIR corrected but i could be wrong and don't know why it hangs down there : )
At 44,1khz here is how synthetic pass-band 1st order 5Hz - 16th order 22050Hz looks verse a real world soundcard loopback.
At 44,1khz here is how synthetic pass-band 1st order 5Hz - 16th order 22050Hz looks verse a real world soundcard loopback.
Attachments

Spice electrical sim : frequency, phase, and time
I finally solved my phase and time issues, but I need 2 posts to explain it.
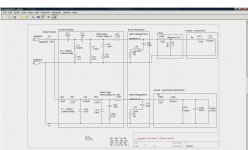
The pics below are from Gschem and NGspice that I use for schematic capture and simulation. The design is a 2 way LR4 @1800 Z=6 with zobels and notch filters. The HF L-pad is just shown as 2 resistors. Note the ngspice plot uses 20 lines/decade (not 10 lines/dec) when the plot gets big so its [1K, 1.5K, 2K, 2.5K....etc] for the freq verticals.
The LR4 electrical performance has a few bumps (freq, phase, time) from the notch filters but the are required to cancel some acoustic issues. The overall behaviour is the same with or without them. The notches flatten the response enough to be used as is with an amp or with mild midband (3-7KHz) correction. It allows me to easily use them with my RPI3 project.
Schematic is pic #1, nothing tricky there.
Graph#2 is a bode plot, shows the XO@1.8KHz, and a few bumps from the notches. Again looks like it should.
The phase in Graph#3 is worth looking at. A 4th order low pass has +360deg shift and a 4th order high pass has -360deg shift. Every time we shift m*360deg we come back to 0, going 1 rotation around the unit circle. This puts the woofer and tweeter in phase again. However, they are 2 cycles apart in time, but still in phase in frequency. That time shift (2 cycles) is hard to see in the phase curves because its generally removed. The graph#3 shows the two signals tracking in phase as they should be. This is an LR4 feature.
Group delay in Graph#4 show the the difference is time delay which converges over frequency and becomes an expected constant. But notice the delays start in different polarities that converged to zero difference. This is an LR4 feature.
The impulse response is where the weirdness was seen and what started this investigation. Its also seem in the simulation. I've also seen it other 3rd party measurements. So it should be expected.
I finally solved my phase and time issues, but I need 2 posts to explain it.
The pics below are from Gschem and NGspice that I use for schematic capture and simulation. The design is a 2 way LR4 @1800 Z=6 with zobels and notch filters. The HF L-pad is just shown as 2 resistors. Note the ngspice plot uses 20 lines/decade (not 10 lines/dec) when the plot gets big so its [1K, 1.5K, 2K, 2.5K....etc] for the freq verticals.
The LR4 electrical performance has a few bumps (freq, phase, time) from the notch filters but the are required to cancel some acoustic issues. The overall behaviour is the same with or without them. The notches flatten the response enough to be used as is with an amp or with mild midband (3-7KHz) correction. It allows me to easily use them with my RPI3 project.
Schematic is pic #1, nothing tricky there.
Graph#2 is a bode plot, shows the XO@1.8KHz, and a few bumps from the notches. Again looks like it should.
The phase in Graph#3 is worth looking at. A 4th order low pass has +360deg shift and a 4th order high pass has -360deg shift. Every time we shift m*360deg we come back to 0, going 1 rotation around the unit circle. This puts the woofer and tweeter in phase again. However, they are 2 cycles apart in time, but still in phase in frequency. That time shift (2 cycles) is hard to see in the phase curves because its generally removed. The graph#3 shows the two signals tracking in phase as they should be. This is an LR4 feature.
Group delay in Graph#4 show the the difference is time delay which converges over frequency and becomes an expected constant. But notice the delays start in different polarities that converged to zero difference. This is an LR4 feature.
The impulse response is where the weirdness was seen and what started this investigation. Its also seem in the simulation. I've also seen it other 3rd party measurements. So it should be expected.
Attachments
Measurement : frequency, phase, time
Now for the measurements. Previously I made a bunch of measurements and did some experiments, none of them gave me insight to get a set of good freq, phase, and time responses simultaneously.
I went and read the REW help manual. When all else fails read the manual . It's wonderfully written by John Mulcahy as a part tutorial part user guide. It explains the measurement methods and issues I'm seeing. Best of all it's an easy read.
I'll list what settings I changed, based on what I observed, because the setting adjustments depend on where and what you are measuring. In this case, I only want the near field speaker, it is not a room or system correction. I am aiming for a min phase and min reflection measurement to correct the speaker only.
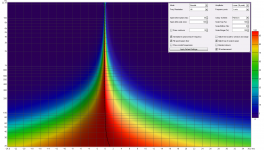
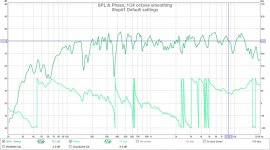
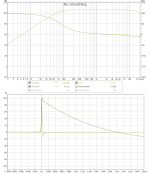
Step#1, take a near field measurement using the defaults settings. Graph#1 shows the results. Lots of phase wrap, and first clue that some settings need fixing. The speaker should be min phase, and all the wraps indicate something else is going on.
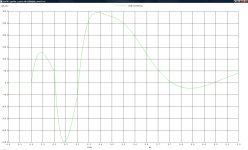
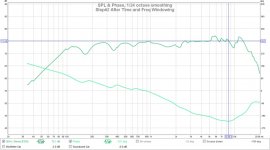
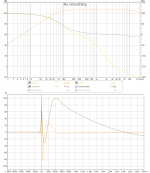
Step#2, remove the room acoustic effects. Using the [IR Window] set the LeftWindow=10ms, RightWindow=20ms, FrequencyWindow=4 and apply. Then using the [Controls] select [Unwrap Phase] button and then use [+/-360] buttons to shift the phase curve to where you would like it. Graph#2 shows the result that is close to what we want. We should see a 0 to-360deg phase curve from our Spice sim, but instead we see +180deg to -180deg curve. There is still a total 360 phase shift but its offset, and that's OK. I think its because the acoustic timing reference has centered "0deg" around its alignment tone.
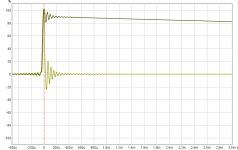
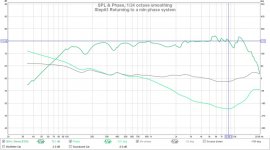
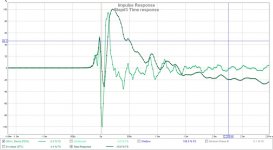
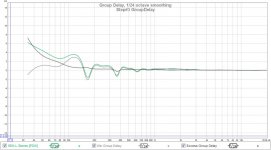
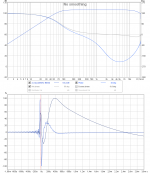
Step#3, generate min phase curve using [Controls] then [Est IR Delay] followed by [Gen Min Phase]. Enable the min phase curve display and possibly use [+/-360] to shift the measured phase and min phase curves together. A speaker should be a min phase system. We can see from Graph#3 curve comparison, that there is some excess phase. Can that be heard and is it making our time response (Grpah#4) weird.? The excess phase is small (time wise) and does not show in the GroupDelay Graph#5 .
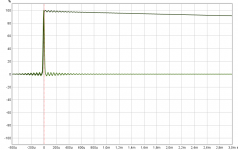
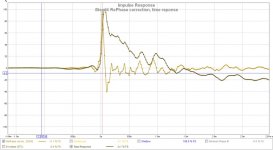
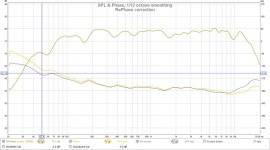
Step#4, I removed some of the excess phase but did not try to make the whole phase curve zero. The amplitude response was flattened using EQ APO 31 band eq. I exported the above measurement from REW as text. Then imported the measurement into RePhase and adjusted only the phase a little. I added phase correction of +90deg over the 2KHz-10KHz band only. The RePhase correction IR was added to the EQ APO convolution engine. The results are in graphs #6 and #7. Looks more like an ideal IR and SR. The REW min phase curve recalculated shows no excess phase now.
I still don't know where the phase difference is coming from but there is no more excess phase and the IR and SR look more normal. Adding +90deg in a limited freq band can be done with analog filters as well.
Now for the measurements. Previously I made a bunch of measurements and did some experiments, none of them gave me insight to get a set of good freq, phase, and time responses simultaneously.
I went and read the REW help manual. When all else fails read the manual
. It's wonderfully written by John Mulcahy as a part tutorial part user guide. It explains the measurement methods and issues I'm seeing. Best of all it's an easy read.I'll list what settings I changed, based on what I observed, because the setting adjustments depend on where and what you are measuring. In this case, I only want the near field speaker, it is not a room or system correction. I am aiming for a min phase and min reflection measurement to correct the speaker only.
Step#1, take a near field measurement using the defaults settings. Graph#1 shows the results. Lots of phase wrap, and first clue that some settings need fixing. The speaker should be min phase, and all the wraps indicate something else is going on.
Step#2, remove the room acoustic effects. Using the [IR Window] set the LeftWindow=10ms, RightWindow=20ms, FrequencyWindow=4 and apply. Then using the [Controls] select [Unwrap Phase] button and then use [+/-360] buttons to shift the phase curve to where you would like it. Graph#2 shows the result that is close to what we want. We should see a 0 to-360deg phase curve from our Spice sim, but instead we see +180deg to -180deg curve. There is still a total 360 phase shift but its offset, and that's OK. I think its because the acoustic timing reference has centered "0deg" around its alignment tone.
Step#3, generate min phase curve using [Controls] then [Est IR Delay] followed by [Gen Min Phase]. Enable the min phase curve display and possibly use [+/-360] to shift the measured phase and min phase curves together. A speaker should be a min phase system. We can see from Graph#3 curve comparison, that there is some excess phase. Can that be heard and is it making our time response (Grpah#4) weird.? The excess phase is small (time wise) and does not show in the GroupDelay Graph#5 .
Step#4, I removed some of the excess phase but did not try to make the whole phase curve zero. The amplitude response was flattened using EQ APO 31 band eq. I exported the above measurement from REW as text. Then imported the measurement into RePhase and adjusted only the phase a little. I added phase correction of +90deg over the 2KHz-10KHz band only. The RePhase correction IR was added to the EQ APO convolution engine. The results are in graphs #6 and #7. Looks more like an ideal IR and SR. The REW min phase curve recalculated shows no excess phase now.
I still don't know where the phase difference is coming from but there is no more excess phase and the IR and SR look more normal. Adding +90deg in a limited freq band can be done with analog filters as well.
Attachments
-
 step#1 default settings.jpg96.6 KB · Views: 121
 -
 step#2 time and frequency windowing.jpg76.1 KB · Views: 125
 -
 step#3 min phase.jpg78.6 KB · Views: 117
 -
 step#3 time response.jpg74.7 KB · Views: 123
 -
 step#3 group delay.jpg77.3 KB · Views: 107
 -
 step#4 rephase corr IR SR.jpg71.6 KB · Views: 114
 -
 step#4 rephase correction.jpg78.9 KB · Views: 107
.....A speaker should be a min phase system. We can see from Graph#3 curve comparison, that there is some excess phase. Can that be heard and is it making our time response (Grpah#4) weird.?.....
.....I still don't know where the phase difference is coming from but there is no more excess phase and the IR and SR look more normal.....
Good piece of work there and think things starts to look close to acceptable, no worry a speaker should track as system minimum phase when its having a physical minimum phase XO point in there because that will add 360º excess phase because REW calculate minimum phase upon amplitude response and don't know anything about its a sum of two pass bands, when single drivers pass band is swept then absolute measured phase should look close to "Generate minimum phase" or if XO filter is linear phase as you tried fix into Rephase
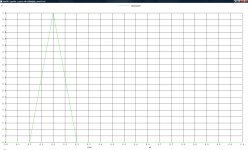
.Below is some synthetic examples showing absolute phase for pass band and REW's calculated minimum phase:
First is one full ranger doing the job, good point look for there is phase lags about 90º at 80Hz as it should and absolute phase and REW's calculated minimum phase tracks close.
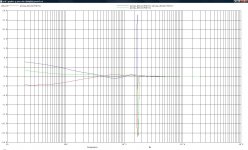
Second is same pass band but with LR 4th order 1800Hz XO point, good point look for there is phase is advanced about -180º at 1800Hz as it should and REW calculate 360º of excess phase for this example compared amplitude response.
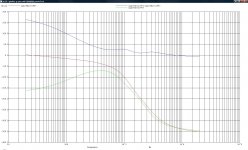
Third is same as second using "Estimate IR Delay" inside a 22.050Hz domain which looks push phase bend upwards just as yours did
.Attachments
Third is same as second using "Estimate IR Delay" inside a 22.050Hz domain which looks push phase bend upwards just as yours did
Thanks for posting the comparison graphs. It's satisfying to see other results in line with what I'm seeing in my measurements.
I'm assuming you used a RePhase template to generate your curves. Is that correct?
Could you explain "inside a 22.05Hz domain" ? I'm not familiar with that.
He means mimicking the bandpass behaviour of your ADC / DAC's reconstruction filter.
By limiting the upper band using a similar filter that a DAC would use to avoid aliasing.
22.05K for a 44.1K sample rate playback / measurement.
Byrtt does it in rephase by creating the filter and outputting to an impulse to import into REW, I'm sure hell be along with his recipe, from memory something like a 14th order filter at 22.05K.
OK that makes sense to recreate antialiasing and reconstruction filters. I'm not sure what they are, the soundchip is a RealTeK ALC889. Its suppose to be 24b up to 192Khz sampling. The datasheet gives a few numbers on scaling the cutoff points but nothing about the nature or order of the filters. When I loopback line out to line in it looks pretty flat with minimal phase shift (20deg?) near 20Khz.
I run everything at 48Khz so it matches the rate required for an RPI.
Thinking a bit more about it. There are other potential delays that I have not ruled out. I think I'll make a fixture to transformer couple and range limit the amplifier output for my line input. That way I can compare simultaneous loopback of line out (on L) and amp output (on R) using the stereo line input. I'm reluctant to connect any power amplifier directly to the line inputs as I don't know how they arranged the offsets or returns.
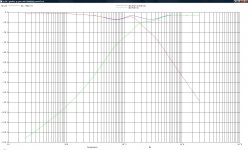
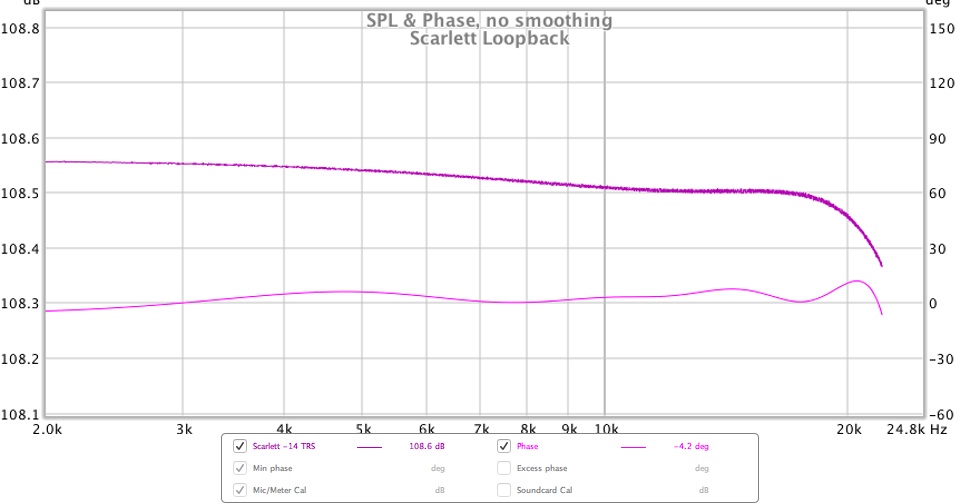
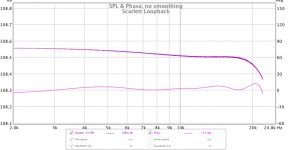
You can get some idea by zooming in near the sample rate half frequency and see the slope of the filter. You can then compare that to the impulse. Most are mixed phase these days a linear brickwall with analogue 6dB filter, but it could be anything. This is my Scarlett the measurement was done at 48 but I set the frequency sweep to 22050 which is why it stops there.
I don't think there is any reason to be scared of checking your amplifier with the soundcard just be careful to make sure the output voltage is under 1V to not blow the input. I did it recently with mine.
I used a 300W 8 Ohm power resistor as a load and connected directly for 1V and under and then made a voltage divider out of low value power resistors for the higher voltage settings on the amp to keep the input to the soundcard at about 1V. 10W power resistors are fairly cheap and easy to get and if you pick the right values the power they dissipate is minimal. Be careful if you try to use a pot, I did and smoked it because I got my calculations mixed up
Attachments
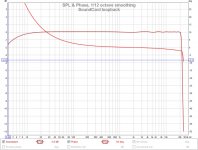
My soundcard on loopback looks pretty good when I zoom in. It clearly has some sort of ac coupling. The phase at high freq is minimal.
A small fixture for isolation / attenuation / level clamping is easy and inexpensive for me to make. That way it won't matter what kind of amp I attach or how they connected the power supplies or output stages. Inherently safe.
A small fixture for isolation / attenuation / level clamping is easy and inexpensive for me to make. That way it won't matter what kind of amp I attach or how they connected the power supplies or output stages. Inherently safe.
Attachments
Soundcard loop back from RXV659
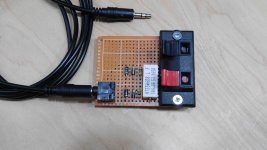
So I made a small fixture so that I could safely loopback the amplifier to the line_in of the sound card. It has 6.8R load for the amp, then balanced 47R resistors to the line_in. The line_in is clamped using 2 sets of diodes (1N4001) so that it can never exceed +/-1.4Vpk.
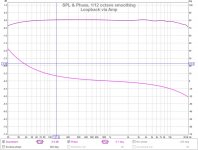
The results are in pic#2. The path is PC -> S/PDIF -> RXV659 -> Line_in. Looks fine to me.
So I made a small fixture so that I could safely loopback the amplifier to the line_in of the sound card. It has 6.8R load for the amp, then balanced 47R resistors to the line_in. The line_in is clamped using 2 sets of diodes (1N4001) so that it can never exceed +/-1.4Vpk.
The results are in pic#2. The path is PC -> S/PDIF -> RXV659 -> Line_in. Looks fine to me.
Attachments
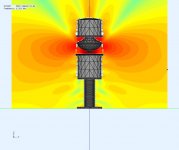
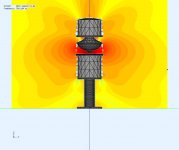
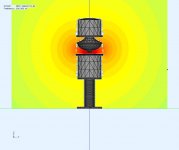
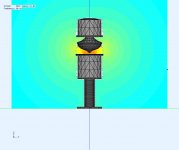
Updating ABEC model
I updated my ABEC model using the new parts that make it a cylinder. It could be a little smoother on the cone surfaces. I'm going to try improve the model and observations technique from ABEC to reflect what I've actually measured.
I updated my ABEC model using the new parts that make it a cylinder. It could be a little smoother on the cone surfaces. I'm going to try improve the model and observations technique from ABEC to reflect what I've actually measured.
Attachments
Adding more pieces...
I have not changed the omni's in a while as I've been busy building other pieces for this system. So I thought I'd update this thread with the associated support pieces.
Playback is from a headless media player (Volumio2) built using an RPI3B + Piano2.1. The setup has 4 DAC outputs with built in nano-DSP that allow a subwoofer output to be generated along with R+L. At Raspberry Pi with Piano2.1 DAC DSP and Volumio2
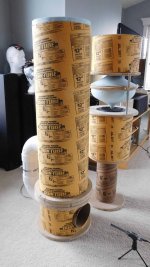
I've left the Omni 8" woofers in a sealed 16L chamber but it doesn't go low enough (FR) for my liking. It turns out that I really like 2 subs to even the bass in the room. The second sub is a series tuned BP6 cylinder using a 12" subwoofer styled to "look like" the Omni's . At SonoTube and SewerPipe BP6 Subwoofer
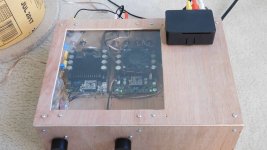
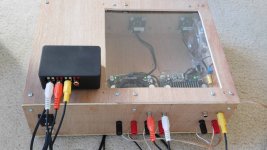
I also wanted a separate amp for the above. I've shyed away from class D amps before so I thought this is a good time to try them out. Both are from Sure Electronics, the sub amp is 1x200w and the Omni LR amp is 2x200w. I use a 36VDc supply that's dialed down to 32VDC (better regulation) that yields 110W to the sub and 55W to each LR. More than enough for me. Everything is boxed in a sureply case with a plexiglass viewing window.
I'm currently trying to transfer the convolution filters developed on my PC to the RPI which can run BruteFir or some other convolution engine. Linux audio is a strange animal
I have not changed the omni's in a while as I've been busy building other pieces for this system. So I thought I'd update this thread with the associated support pieces.
Playback is from a headless media player (Volumio2) built using an RPI3B + Piano2.1. The setup has 4 DAC outputs with built in nano-DSP that allow a subwoofer output to be generated along with R+L. At Raspberry Pi with Piano2.1 DAC DSP and Volumio2
I've left the Omni 8" woofers in a sealed 16L chamber but it doesn't go low enough (FR) for my liking. It turns out that I really like 2 subs to even the bass in the room. The second sub is a series tuned BP6 cylinder using a 12" subwoofer styled to "look like" the Omni's . At SonoTube and SewerPipe BP6 Subwoofer
I also wanted a separate amp for the above. I've shyed away from class D amps before so I thought this is a good time to try them out. Both are from Sure Electronics, the sub amp is 1x200w and the Omni LR amp is 2x200w. I use a 36VDc supply that's dialed down to 32VDC (better regulation) that yields 110W to the sub and 55W to each LR. More than enough for me. Everything is boxed in a sureply case with a plexiglass viewing window.
I'm currently trying to transfer the convolution filters developed on my PC to the RPI which can run BruteFir or some other convolution engine. Linux audio is a strange animal
Attachments

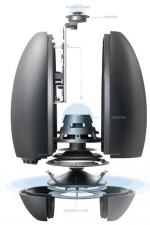
Harman created an omnipolar speaker a few years ago. I stumbled across the patent while looking at what Samsung's been filing these days. (Always interesting food for thought in patents.)
Here's one of the patents: https://patentimages.storage.googleapis.com/46/b1/af/6f8f32e4907516/US10469942.pdf
And another: https://patentimages.storage.googleapis.com/f8/13/3b/93aac97d732019/US10034081.pdf
Here's one of the patents: https://patentimages.storage.googleapis.com/46/b1/af/6f8f32e4907516/US10469942.pdf
And another: https://patentimages.storage.googleapis.com/f8/13/3b/93aac97d732019/US10034081.pdf
Attachments
^ thanks P.B. for posting those patents.
Some interesting ideas to try out. The resonator/absorber for LF corrections and a a loaded disc channel feeding a radial horn for HF. It's been a while since I touched these Omnis. I particularily like the dual opposed drivers for HF and I actually tried the idea using PC83 drivers a few yrs ago.
Some interesting ideas to try out. The resonator/absorber for LF corrections and a a loaded disc channel feeding a radial horn for HF. It's been a while since I touched these Omnis. I particularily like the dual opposed drivers for HF and I actually tried the idea using PC83 drivers a few yrs ago.
Why couldn't a guy work out a sort of synergy omni using the regular synergy arrangement of drivers but reshaping the waveguide(s) to an omni directivity pattern. Have a high frequency driver firing down inside the upper clam shell and maybe (4) mids arranged in the lower clam shell firing up through ports. The upper and lower shells would be concave/convex facing shapes ... forming an acoustic lens?
Can see something like this in a globe shaped sphere and the equator emitting the sound.
Can see something like this in a globe shaped sphere and the equator emitting the sound.
Except getting a good omni MF/HF wavefront is difficult for good reasons. I enjoy listening to omni's so I'm always in interested in a new approach.
The drivers are all voice coil based and radiate like pistons. That pattern needs shaping/redirection into a cylindrical or toroidal pattern without excess reflections, diffractions or cavity resonances while trying to bend the wavefront 90deg. My previous attempts were concentric cones (ie. compression driver on a radial horn) and MF reflectors based on Duevel speakers They work but also have all the problems as well. In a conventional horn or monopole the piston is at least pushing air in the right direction.
The drivers are all voice coil based and radiate like pistons. That pattern needs shaping/redirection into a cylindrical or toroidal pattern without excess reflections, diffractions or cavity resonances while trying to bend the wavefront 90deg. My previous attempts were concentric cones (ie. compression driver on a radial horn) and MF reflectors based on Duevel speakers They work but also have all the problems as well. In a conventional horn or monopole the piston is at least pushing air in the right direction.
- Home
- Loudspeakers
- Multi-Way
- OmniDirectional - work in progress