Hello, all.
For all the explanation above, this method just uses a very simple spreadsheet calculation. I'm interested in comments on the method and result presented.
Cheers,
Dan

Hi Dan,
Everything you describe seems technically sound but I am confused a bit by the diagrams.
Your A and B look very nominally to be the same shape, but their scales are different by a factor of ten. B looks realistic. I don't know why A would be devoid of detail. It is too smooth. From this I don't know why the difference, C, would be a smooth curve. It might help to see the response curves that go with the phase curves.
David
Hello Dave,
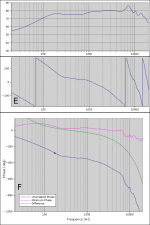
Graph E in the attached figure shows the raw magnitude and phase measurements for the driver for reference. Note that the phase contains the driver phase characteristics and the time delay component. This is way the phase wraps around the -180 deg mark several times.
Graph F shows a comparison between the unwrapped phase, the calculated minimum phase, and the difference between the two. Because of the phase wrapping in E, when unwrapped, the phase ventures many times lower than -180 deg. The minimum phase, however, by definition, is constrained to +-180 deg. This is why there is a such a large difference in the scale of the two curves. If I would have gathered all of the phase data from 0ms of the impulse response, the different in scale would be much larger.
Because they are plotted on the same range (which they weren't in graphs A and B above), it can be seen that the ripples in both the two curves are the indeed same magnitude. When the curves are subtracted, we get the green curve in F, which is a smooth logarithmic curve on this logarithmic axis. When plotted on a linear scale as in C, the curve is indeed a smooth line and the time delay information can be deduced with just the slope of this line as illustrated above.
I hope that clears it up a bit!
Attachments
Simon’s method of using excess GD to measure the in situ acoustic offset of drivers seemed correct to me so I ran a little experiment on a speaker. I am sharing my results for your consideration.
I believe the method works fine and can give a very accurate relative driver acoustic offset with one simple measurement.
Provisos:
> The band pass portion of the driver should be utilized for determining the offset. Avoid using the range where the influence of the XO filter or the coil impedance is influencing the phase response of the driver.
> The XO network and probably the “box filter” add delay to the drivers so the results are relative to only the specific situation being measured.
> As mentioned, this says nothing about the phase alignment through the XO range.
> As mentioned, it would be difficult to measure the offset of a SW from a MW using the mic at LP due to all the room mode effects.
Measurement Conditions:
> 6.5” MW and 1” dome TW in a sealed box.
> DCX2496 XO filters: LP LR-48 at 2.03 Hz, HP But-18 at 2.03 Hz. [The polarity is reversed between them.]
> Acoustic XO at 1.8 kHz
> Mic at 30 inches from the baffle and very near the LP axis.
> REW Measurement IR was offset such that the peak is at 0 ms.
> The measurement was gated at -0.03 ms and +7 ms
The Measurements:
Current Reference DCX Setting; MW delay = -0.51 ms (174 mm) [relative to the TW]

Regarding the above measurement:
The bandpass portion of the TW is between 4k and 7k Hz, and the bandpass section of the MW is between 500 and 1k Hz. I avoided using the TW HF above 8 kHz where the coil impedance influences the phase.
The delta of Excess GD is measured at about +0.05 ms between these frequency ranges as shown.
I have no way to knowing if this is the correct value at this point, but using the DCX I changed the delay on the MW +0.51 ms and remeasured:

Now the above offset is about +0.56 ms or an increase of +0.51 ms. That’s the same value that was added to the MW delay. This suggests to me that this is a viable method to measure the effective acoustical offset between drivers in situ as Simon suggested.
I also changed the MW LP filter from LR-24 to But-6 and confirmed that there is a significant impact on the relative acoustic offset as expected (about -0.40 ms relative to the reference):

This highlights that the results are only relevant to the exact system being measured and say nothing about the raw drivers.
I’m a hobbyist and not sure this experiment is conclusive, but thought you may find it interesting.
I believe the method works fine and can give a very accurate relative driver acoustic offset with one simple measurement.
Provisos:
> The band pass portion of the driver should be utilized for determining the offset. Avoid using the range where the influence of the XO filter or the coil impedance is influencing the phase response of the driver.
> The XO network and probably the “box filter” add delay to the drivers so the results are relative to only the specific situation being measured.
> As mentioned, this says nothing about the phase alignment through the XO range.
> As mentioned, it would be difficult to measure the offset of a SW from a MW using the mic at LP due to all the room mode effects.
Measurement Conditions:
> 6.5” MW and 1” dome TW in a sealed box.
> DCX2496 XO filters: LP LR-48 at 2.03 Hz, HP But-18 at 2.03 Hz. [The polarity is reversed between them.]
> Acoustic XO at 1.8 kHz
> Mic at 30 inches from the baffle and very near the LP axis.
> REW Measurement IR was offset such that the peak is at 0 ms.
> The measurement was gated at -0.03 ms and +7 ms
The Measurements:
Current Reference DCX Setting; MW delay = -0.51 ms (174 mm) [relative to the TW]
Regarding the above measurement:
The bandpass portion of the TW is between 4k and 7k Hz, and the bandpass section of the MW is between 500 and 1k Hz. I avoided using the TW HF above 8 kHz where the coil impedance influences the phase.
The delta of Excess GD is measured at about +0.05 ms between these frequency ranges as shown.
I have no way to knowing if this is the correct value at this point, but using the DCX I changed the delay on the MW +0.51 ms and remeasured:
Now the above offset is about +0.56 ms or an increase of +0.51 ms. That’s the same value that was added to the MW delay. This suggests to me that this is a viable method to measure the effective acoustical offset between drivers in situ as Simon suggested.
I also changed the MW LP filter from LR-24 to But-6 and confirmed that there is a significant impact on the relative acoustic offset as expected (about -0.40 ms relative to the reference):
This highlights that the results are only relevant to the exact system being measured and say nothing about the raw drivers.
I’m a hobbyist and not sure this experiment is conclusive, but thought you may find it interesting.
Hi Gveto,
Thanks for the added curves. I can better see what you are doing now. Your latest plots look perfectly plausible.
Nothing wrong with your assumptions, but here are a couple of comments. We assume that individual drivers are minimum phase. Except for a few example, say whizzer cone units, this is always found to be the case. If you have a phase curve of a minimum phase object, and a simulated phase curve from it's Hilbert transform, you can expect no difference between them except for pure time delay. This would be a straight line on the linear frequency scale.
You get a smooth but not a linear curve for that phase difference. This shouldn't be. The problem with the Hilbert transform is that it is very sensitive to the band edge roll off rates. A woofer needs to roll of at 12 dB per Octave and with that it will have a phase rise of 180 degrees. If your gated measurement doesn't accurately capture these roll offs then the computed phase won't be accurate. The best approach is to use a curve extending technique that gives the right slopes at both ends. That is the only way to get accurate phase.
Read through the LEAP documentaion for more on that.
David S.
Hi Gveto,
...
You get a smooth but not a linear curve for that phase difference. This shouldn't be.
...
David S.
Hello David,
Have a look at graph C in my original post. This is the same curve (on a linear scale) as the green curve in F, that is, the difference between the unwrapped phase and the calculated minimum phase. You will see that it is indeed (very) linear over my selected frequency range for evaluation, 1khz - 10khz. In fact, the graphed data is almost completely obscured by the fitted line. Maybe that's why it is difficult to see what's going on.
You are correct about the errors introduced in the Hilbert transform in the low frequencies. This is, as you said, due to the incorrect roll-off of the driver measurement because of the time-bandwidth requirement not being met in this range. This is also why the y-intercept of the fitted line is not 0 deg as it should be with an ideal time delay. As I said, I did no tail correction to the plots.
The nice part about using the slope of the phase difference in the region where the phase difference is very linear, is that these errors do not affect the outcome. Indeed, the slope of the line in this region where the measured phase and calculated minimum phase is known to be accurate, is all we need to know to derive the time delay. Discarding the faulty y-intercept corrects this line to represent a pure time delay.
Dan
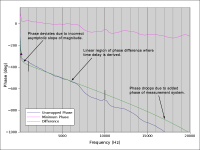
I have added another graph to help clarify my comments above. This graph is the same graph as graph plot F above, only with a linear frequency axis to show the linear nature of the phase difference. The vertical black lines indicate the upper and lower frequency bounds we are considering.
 BUT WAIT!
It is easily seen that the green line is not in the same position in the attached plot as it is in plot F above. This is because I made an error when I created the green curve in plot F. I used the phase difference in that graph AFTER I had added the necessary 353.127 deg offset to correct for the low frequency anomalies we have been discussing. That is, the green line is simply shifted upward in plot F. This is the technique I described in my second formula.
The beauty part of the slope method is that this shift does not matter, and the same result for time delay is derived from either green line.
END GOOF UP
BUT WAIT! It is easily seen that the green line is not in the same position in the attached plot as it is in plot F above. This is because I made an error when I created the green curve in plot F. I used the phase difference in that graph AFTER I had added the necessary 353.127 deg offset to correct for the low frequency anomalies we have been discussing. That is, the green line is simply shifted upward in plot F. This is the technique I described in my second formula.
The beauty part of the slope method is that this shift does not matter, and the same result for time delay is derived from either green line.
END GOOF UP Attachments
Last edited:
That method is a manual calculation of the excess group delay, which I believe ARTA will happily calculate for you if you ask it nicelyFor all the explanation above, this method just uses a very simple spreadsheet calculation. I'm interested in comments on the method and result presented.
")
Yes, precisely, hence the reason why I presented the excess group delay method in the first place...That method is a manual calculation of the excess group delay, which I believe ARTA will happily calculate for you if you ask it nicely
Group delay is essentially phase differentiated, (eg the absolute value of group delay represents the slope of the phase curve at that point) excess group delay is the excess phase differentiated - therefore the absolute value of excess group delay is the slope of the component of the phase curve that is NOT due to minimum phase amplitude response variations...
The idea being that in the pass band of driver A (and with sufficient stop band attenuation of driver B) the excess group delay will be representative of the time delay from driver A, whilst in driver B's pass band representative of the time delay from driver B.
Whilst we can't know with a high degree of certainty the absolute time delay to a driver for the reasons dlr went into, if we choose one driver as our reference point (done in ARTA by adjusting delay for phase estimation so that the pass band of that driver has 0 time delay in excess group delay) we can then find a relative time delay to the other driver seemingly with extremely good precision. (Down to just a few millimetres or less)
There are a few cavets though -
1) There needs to be sufficient stop band attenuation of each driver within the passband of the other so that the excess group delay in one drivers passband is not significantly influenced by the response of the other driver, meaning that steeper filters are better. (Probably a minimum of 12dB/oct required, I tested with 18dB/oct)
2) Sufficient window time to get a low enough frequency response to be able to measure the passband of the lower frequency driver accurately.
3) Sufficient high frequency response (high enough sample rate) to be able to measure the bandpass of the high frequency driver accurately.
4) A reasonable degree of phase tracking between the drivers - I've found they need to be within +/- 120 degrees of phase tracking with each other to give accurate results. If they're 180 degrees out of phase (for example an in phase 2nd order crossover connected the wrong way around) the sudden phase reversal at the notch point causes misleading results. Note: accurate phase tracking isn't required, just avoiding the 120-240 degree cancellation region.
Last edited:
If my understanding of how it works is correct, its not that we need to avoid the "influence" of the crossover filter, (after all the crossover is minimum phase) simply that we want to measure the excess group delay at two frequencies where the stopband attenuation of the opposite driver is sufficiently great.Provisos:
> The band pass portion of the driver should be utilized for determining the offset. Avoid using the range where the influence of the XO filter or the coil impedance is influencing the phase response of the driver.
In other words as far apart as possible whilst still remaining within the normal bandpass of both the drivers and measurement system.
I don't believe this is the case. If the crossover slopes are sufficiently steep and the other provisos in my previous post are met, I believe that the results should be independent of the specific crossover, although the degree of error may vary a bit with different crossover slopes.> The XO network and probably the “box filter” add delay to the drivers so the results are relative to only the specific situation being measured.
There is a significant amount of ripple in your measurements which suggest to me that you have some measurement reflections creeping into your window time, this may be causing you some inaccuracies.The Measurements:
Current Reference DCX Setting; MW delay = -0.51 ms (174 mm) [relative to the TW]
View attachment 274335
Regarding the above measurement:
The bandpass portion of the TW is between 4k and 7k Hz, and the bandpass section of the MW is between 500 and 1k Hz. I avoided using the TW HF above 8 kHz where the coil impedance influences the phase.
The delta of Excess GD is measured at about +0.05 ms between these frequency ranges as shown.
I have no way to knowing if this is the correct value at this point, but using the DCX I changed the delay on the MW +0.51 ms and remeasured:
View attachment 274336
Now the above offset is about +0.56 ms or an increase of +0.51 ms. That’s the same value that was added to the MW delay. This suggests to me that this is a viable method to measure the effective acoustical offset between drivers in situ as Simon suggested.
I had no ripple at all in any of my test measurements with ARTA.
The large amount of ripple both at high and low frequencies suggests to me that there is something wrong with this measurement, I would double check your window time and perhaps try another program like ARTA to see if you get the same effects. The ripples in excess group delay between 3Khz and 8Khz look totally bogus to me, so are likely to be a measurement artefact. (a 1st order filter should have less group delay than a 4th order, not more...)I also changed the MW LP filter from LR-24 to But-6 and confirmed that there is a significant impact on the relative acoustic offset as expected (about -0.40 ms relative to the reference):
View attachment 274337
This highlights that the results are only relevant to the exact system being measured and say nothing about the raw drivers.
As I mentioned earlier, a 1st order filter is probably not going to give accurate results due to insufficient stop band attenuation. (But still shouldn't show ripple like this)
Simon, Thanks for the feedback.
As you noted there are issues with regard to my calibration. I have been aware of this, but with my current setup I haven’t been able to rectify it. Also REW does not add the calibration information into the IR it just adds the adjustments to the SPL and phase charts. The IR still reflects the uncalibrated condition. I am not sure if the GD and EGD include the cal adjustments or not. These issues are trival for 95% of the work I do so it is not a major concern for me.
I didn’t notice the additional delay I added appeared to shift the EGD in the wrong direction. It seems I am always getting things backwards. Maybe I should just turn around.
I'll wait until I am using ARTA and have solved my calibration issues before I try it again.
I have been trying the excess gd method presented in this file and found a couple of pratical issues.
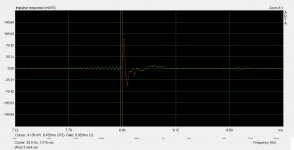
Any IR have some physical width in samples. Very thin impulses for a ribbon tweeters, or very thick, with a long rise time for a subwoofer. And there is always some pre-ringing...The question is : where shall i locate the yellow cursor, on what sample, if i want it to be at T=0, the beginning of the IR?
BTW, we have a second issue, due to the fact that we have a discrete time scale, and the time resolution is related to the sampling freq: 1 sample resolution at 44khz is 1/44000, that is aprox 20uS, that is aprox 8mm. It seems to be the best precision we can expect by clicking for yellow cursor location.
Attachments
Last edited:
What i mean is that whatever the method used, excess gd or other, the question is not if the method is good or not, but rather: does it always make sense to worry about the idea of estimating the time offset between 2 drivers.
If the drivers are similar enough, 2 tweeters for instance, i think it does, and i don't see why the excess gd method would be worse than any other. But if not, that is when the 2 drivers have too disimilar IRs, then we open an awfull, and probably pointless, can of worms.
I would make this statement: even if the drivers have significants, thus usefull overlaps, any measurement of time offsets will be valid if the same sharp band pass filters are applied to both drivers IRs response. The offset we measure in this case is due to the distance between drivers ACs, nothing more. But why should we bother?
Last edited:
The initial rise slope of the impulse is determined by the high frequency cut-off of the driver - the higher in frequency it goes the steeper the slope.I have been trying the excess gd method presented in this file and found a couple of pratical issues.
Any IR have some physical width in samples. Very thin impulses for a ribbon tweeters, or very thick, with a long rise time for a subwoofer.
Meanwhile the width of an impulse (roughly) represents the low frequency cut-off of the driver. A tweeter with a high cut off frequency will have a narrow impulse, a woofer will have a much wider one. Not that it matters for the measurement of excess group delay as presented.
Pre-ringing only happens with linear phase filters, so either you have some sort of active crossover using linear phase filters, or the sound card itself has steep linear phase filters in either the DAC or ADC stages, or is doing sample rate conversion due to your measurement software trying to use the card in a non-native sample rate.And there is always some pre-ringing...
I don't see any noticable pre-ringing on any of the impulse measurements I take in ARTA with my sound card used at a native sample rate. (I normally use 96Khz, the only other native sample rate for my card is 48Khz, all others introduce undesirable resampling)
You never want to put the cursor exactly at time zero for any type of impulse measurement. The cursor must always be before the beginning of the impulse, including any pre-ringing. How much before doesn't really matter, as long as there are at least a few zero samples to be sure you haven't clipped the beginning off the impulse. Better to err on the side of putting it a few extra samples earlier.The question is : where shall i locate the yellow cursor, on what sample, if i want it to be at T=0, the beginning of the IR?
When measuring phase or group delay in ARTA the setting "delay time for phase estimation" is an additional computed delay from the location of the start cursor, so the earlier you set the start cursor the greater the delay time for phase estimation will be to get the same absolute phase curve, but it makes no difference to the end result as long as the start of the impulse isn't clipped off.
I think you misunderstand how this approach works. We're not trying to measure a time delay based on counting discrete samples of an impulse.BTW, we have a second issue, due to the fact that we have a discrete time scale, and the time resolution is related to the sampling freq: 1 sample resolution at 44khz is 1/44000, that is aprox 20uS, that is aprox 8mm. It seems to be the best precision we can expect by clicking for yellow cursor location.
This is one of the problems with trying to measure relative acoustic centres by measuring the drivers independently and trying to visually identify the start of the impulse - even if you could identify it you still have to choose a discrete sample which has an inherent +/- 1 error, (+/- 20us at 44Khz) and when you consider you have two separate measurements that then becomes a +/- 2 error, or +/- 40us eg +/- 16mm.
(Another issue is that doing two separate measurements on PC based measurement systems with sample identical timing is not trivial, and introduces more error unless done perfectly)
This method doesn't suffer from this limitation - we don't need to even look at the impulse at all (except to make sure the start marker isn't clipping the beginning of the impulse) and all the information needed to figure out the relative acoustic centre offsets is captured in the phase relationship of a single measurement.
Digital samples also have far greater phase accuracy at high frequencies than the sample rate would suggest. Just because the sample rate might be 44.1Khz and therefore a single sample 22.7uS wide doesn't mean that the phase resolution of the reconstructed signal is similarly limited to discrete jumps in time/phase of this size.
An input sine wave just below the nyquist frequency whose phase is drifting relative to the sample period doesn't just suddenly snap between in and out of phase as the positive and negative halves of the sine wave drift within sample boundaries... the reconstructed signal will preserve the original phase relationship down to fractional sample period amounts. (Assuming low jitter)
The upshot of this is that the accuracy of phase measurement in a sampled signal is much greater than the sample period itself, and doesn't present a problem for this measurement approach, as far as I can see.
What i mean is that whatever the method used, excess gd or other, the question is not if the method is good or not, but rather: does it always make sense to worry about the idea of estimating the time offset between 2 drivers.
I've never worried about driver offset among similar drivers, that is for one 1" dome tweeter vs. the next. But obviously phase offset amongst drivers in a system is a major issue to be dealt with.
Since we find that drivers are primarily minimum phase and drivers plus network are still minimum phase, the real issue is the shift between one "way" and the next, and how we get them to blend by picking the right order and polarity.
I regret that I haven't kept track of the crossover orders that I have used over the many systems designed. If you think of it, a 2 way system with 1" dome and 6 or 8" woofer, crossing at 3k (what percentage of the product universe does this cover?) probably only has a solution or two for Linkwitz Riley type blending. A 3 way system would have a few more variables but might also show a small number of common solutions.
Regarding section group delay, all multiway loudspeakers are an assemblage of bandpasses. For a bandapass the highpass corner bends phase up and the upper lowpass corner bends the phase down. The center of the bandpass (generally) is without extra phase shift and reveals the group delay tied to the driver depth. Usually when viewing the whole system's group delay you can see a fairly constant delay time for each section (2 way or 3 way) as long as band edge delays aren't swamping the view. While your crossover choices (order and section polarity) definitely impact phase at the transitions, they tend not to mess with middle-of-section group delay.
Regards,
David
I regret that I haven't kept track of the crossover orders that I have used over the many systems designed. If you think of it, a 2 way system with 1" dome and 6 or 8" woofer, crossing at 3k (what percentage of the product universe does this cover?) probably only has a solution or two for Linkwitz Riley type blending. A 3 way system would have a few more variables but might also show a small number of common solutions.
David
Even if some delay is added, electronic or physical, the bandwith limitations of the drivers will never really allow to apply any arbitrary LR solution. More flexibility will be gained, but some tweak will always be needed, especially if low order slopes are required. No exact nor absolute time offset to be found, i'm afraid, only xover choice related aproximations.
Last edited:
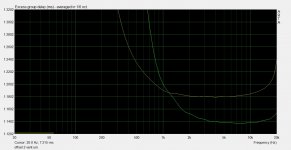
The bending of phase at the bottom and top end of each bandpass is a minimum phase characteristic where the phase shift introduced is a result of the amplitude response, so what's neat about measuring excess group delay (derived from excess phase) is that this effect is entirely eliminated in the measurement, so we don't need to guess where in the passband the phase shift might be neutral. Also the passband being flat is assumed in the above as non flatness of amplitude response of real drivers is obviously going to introduce phase shift and group delay.Regarding section group delay, all multiway loudspeakers are an assemblage of bandpasses. For a bandapass the highpass corner bends phase up and the upper lowpass corner bends the phase down. The center of the bandpass (generally) is without extra phase shift and reveals the group delay tied to the driver depth.
The excess group delay of a single band-passed driver (combination of electrical and acoustic roll-offs) is a flat line, assuming both the driver and crossover section are minimum phase, which as you say usually the case except for weird exceptions like whizzer cone drivers which are really all-pass systems in and of themselves...
The measurements of "normal" drivers I've taken with and without added crossover confirm this flat line response for excess group delay. Because the phase/group delay variations caused by non flatness of amplitude response are eliminated even if the driver has a fairly jaggy (but still minimum phase) response it doesn't matter - the excess group delay is a flat extremely smooth line without any smoothing applied.
(The excess group delay curve I posted right back in the original message was not smoothed, so even though the amplitude/phase response of the driver and baffle was quite jaggy, once the calculated minimum phase was subtracted from the measured phase the excess phase left over is an extremely smooth curve, and therefore so is the excess group delay)
The main limitations are that the excess group delay does diverge from a flat line at very low and very high frequencies, but I believe this is due to measurement bandwidth limitations, not any actual change in excess group delay of the system. (Since the phase shift is affected by amplitude response well outside the measured bandwidth a finite bandwidth will introduce phase errors at the edges of the measurement bandwidth...)
With a 96Khz sampling rate I find the line flat well out past 20Khz, and at the bottom end it depends on the window length of the impulse...typically within about an octave or two of the time bandwidth limit the line is flat.
Because the amplitude related phase variations are eliminated it makes it very revealing of the true pure time delay in the system. (In typical measurements I find the excess group delay of the multiway system to be a tiny fraction of the normal group delay variations which are due to amplitude response non flatness)
Exactly. And when viewed as excess group delay this becomes plainly obvious - the crossover only affects the group delay of the transition region - how much the group delay increases near the crossover frequency and over what bandwidth. Within the bandpass of each unit (where adjacent drivers are sufficiently attenuated in their own stopbands) the excess group delay is purely down to the time delay of the drivers, which is the basis for trying to use it as a measurement technique for relative acoustic centre offset.Usually when viewing the whole system's group delay you can see a fairly constant delay time for each section (2 way or 3 way) as long as band edge delays aren't swamping the view. While your crossover choices (order and section polarity) definitely impact phase at the transitions, they tend not to mess with middle-of-section group delay.
As for the "does it matter" or "is it audible" part of the discussion, what I find interesting is that some people (not referring to you here) believe that group delay at a crossover frequency introduced by the crossover is audible (despite only typically spanning 1 to 2 octaves) yet somehow a group delay difference between two drivers due to acoustic offset which causes a group delay shift potentially spanning many more octaves somehow isn't audible.
Again referring to my original example we had a 3rd order filter with the tweeter acoustic centre only 20mm ahead of the woofer - considerably less than some designs, and we can see that the crossover itself introduces group delay of 0.15ms near the crossover frequency, but a modest 20mm driver offset introduces a group delay of 0.1ms - almost as much as the crossover but over 4-5 octaves. (Everything below about 3Khz...)
From what I can remember the ear is sensitive to inter-aural time differences as small as 20uS, what is unanswered is whether its sensitive to time delays in the order of 100-150uS between fundamentals and harmonics which span the two different passbands which have different group delays...
We can't do much about the group delay introduced over a narrow range by the all-pass nature of the crossover itself, but we can eliminate the gross delay error between the drivers so that the bulk of the passband of each driver arrives in time with its neighbours with just a modest bump in the delay at the transition frequency.
Does it matter ? Not for tonal balance obviously, but for timing related cues ? Maybe. I'm not convinced either way to be honest, but I wonder if its something that hasn't been given enough attention, simply because its "too hard" to time align drivers in most designs due to physical constraints and diffraction issues, and that the effect may be subtle.
Could part of the imaging "magic" of some full range drivers simply come down to timing coherency of not having any gross (shelved) group delay variations between high and low frequencies which is commonplace on flat baffle non time aligned speakers ? Worthy of further investigation I think.
Last edited:
Could part of the imaging "magic" of some full range drivers simply come down to timing coherency of not having any gross (shelved) group delay variations between high and low frequencies which is commonplace on flat baffle non time aligned speakers ?
I agree, but i still don´t see the need to measure the time offset to get a time aligned system...
My point is choose and build a suitable xover and then add whatever delays are necessary to get the best blend. Thats what do with the linear phasr FIR filters i use.
- Status
- This old topic is closed. If you want to reopen this topic, contact a moderator using the "Report Post" button.
- Home
- Loudspeakers
- Multi-Way
- Measuring driver acoustic offset using excess group delay ?