Here is the data graph requested.
Wow! That was quick. Much appreciated!
Any chance you can provide an average for the different mic locations similar to the room data?
Thanks also for the additional background information on the tests, which provides useful context for interpreting the results.
I trust you don't think I was in any way disparaging your measurement technique or results. I know how difficult it is to undertake measurement sets like this and account for all variables, many of which are beyond your control. I was merely trying to point out some areas where differences between theory and experimental results might need a closer look...for those of us who find such things interesting.
Last edited:
Very helpful to have that kind of detail. It establishes that whatever factors - acoustical, accidental, "room gain," mic placement, less-than-honest selection of best curves, and so on - the boost isn't because of "room gain" because that requires a sealed room.snip
The room used was not sealed at all. The house was built in 1894 and this was a wood frame room over crawlspace with old duct work and a couple of large openings to other very large spaces. About as far from sealed as it gets. The Jeep was a standard model Grand Cherokee of 2004 vintage as driven every day that had a sealed enclosure placed in the cargo hold facing the back glass about 4" from the hatch. The measurements indicate what a single 90dB sensitive 4ohm woofer in a sealed enclosure driven by just 20 volts input can do in a medium sized SUV. Force multiplication at its finest.
snip
You can't have it both ways. If sealed, some of the boost at 4 Hz seem on those charts might be due to "room gain" and if not sealed since 1894... not "room gain." Which is it?
Footnote: I've subsequently read Bolserst reply. He seems to be questioning if "choice" of mic location might just have been a wee bit more favorable than other locations.
Ben
Some amount of pressurization still occurrs in a leaky container(or room) the amount of which will depend on the size of the leak in comparison to the incoming/outgoing volume/velocity. You just won't get the full pressure increment you would have for an equivalent sealed case....the boost isn't because of "room gain" because that requires a sealed room.
I wasn't questioning the mic location choices. I was requesting a curve that averages the data for the different mic locations so as to smooth out the effects of the modal region above the pressurization region. Pressurization gain is essentially identical for all mic locations...as evidenced by data for the different mic locations collapsing to one curve as we move to the left hand side of the plots.I've subsequently read Bolserst reply. He seems to be questioning if "choice" of mic location might just have been a wee bit more favorable than other locations.
Some amount of pressurization still occurrs in a leaky container(or room) the amount of which will depend on the size of the leak in comparison to the incoming/outgoing volume/velocity. You just won't get the full pressure increment you would have for an equivalent sealed case.
I wasn't questioning the mic location choices. I was requesting a curve that averages the data for the different mic locations so as to smooth out the effects of the modal region above the pressurization region. Pressurization gain is essentially identical for all mic locations...as evidenced by data for the different mic locations collapsing to one curve as we move to the left hand side of the plots.
Do correct me, but putting some flesh on those abstract bones, my understanding is that a small leak (or plaster or wallboard walls and ceiling or wood floors) leads to a big loss of "room gain."
I agree looking at the different curves would be informative. It also might show that the listener can expect large variations depending on where he/she locates their chair or mic. Which in turn, shows what an unproductive exercise it is to try catch a "wave" when what you really want is to focus on good acoustical/psychoacoustical design, not rabbit's foot theories.
Ben
Last edited:
That has been my experience. When I attempted to measure room gain in a small room(largest dimension = 10ft) I saw a maximum gain slope of roughly 6dB - 9dB which quickly tapered off. However, I did not look at frequencies below 10Hz. The data trends that Josh Ricci posted for the Jeep are nearly identical to what I have measured in automobiles in the past, so I see no reason to suspect the validity of the room gain measurements. Besides pressurization gain below 10Hz, perhaps there could be some contribution from a helmholtz resonance as Calvin suggested. I don't know.… my understanding is that a small leak (or plaster or wallboard walls and ceiling or wood floors) leads to a big loss of "room gain."
For me, the take-away from these room measurements(even if one assumed all gain shown below 10Hz could be attributed to pressurization gain) would be that for even small rooms, the pressurization gain effect will be limited to the lowest end of the audio spectrum(<25Hz). And, for purposes other than reproducing some movie sound effects, will be a small contributor compared to response peaks/dips from modal activity in the room. No rabbit foot required….
Perhaps time to return to thread topic of MFB?
Agreed:
1. you need a rabbit's foot to get "room gain" over maybe 10 Hz.
2. you do not need a rabbit's foot to get "room gain" below 5 Hz, if the room is solid and well sealed or a Jeep.
3. getting back to MF is what we should be doing.
Ben
1. you need a rabbit's foot to get "room gain" over maybe 10 Hz.
2. you do not need a rabbit's foot to get "room gain" below 5 Hz, if the room is solid and well sealed or a Jeep.
3. getting back to MF is what we should be doing.
Ben
Hello Amand,
Could you post an FFT spectrum of the subwoofers THD performance without motion (MF) feedback and with MF feedback, I think THD numbers do not give enough information and the magnitude of the frequency components that cause the distortion with and without MF feedback would be more informative.
Regards
Arthur
I am away on vacation now but I have the FFT from REW on my computer. Please note that the SPL levels in REW are only relative. The output from mic and accel are very different and nothing is calibrated. The only thing I have done is to make sure all measurements are done at the same level is to measure 18,5V RMS on the terminals
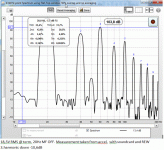
No MF measured with accelerometer
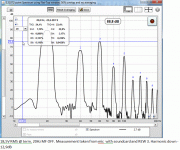
No MF measured with microphone
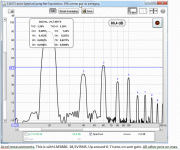
This is with MF and measured with accelerometer
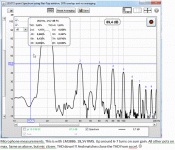
This is with MF and measured with microphone
You might consider taking the captured accelerometer data(blue curve) and applying a full Hanning or Blackmann window and then perform an FFT on the windowed data. The resulting frequency response curve should let you know if the sharp knee you are seeing contains only frequencies that are harmonically related to the fundamental, or perhaps also some content related to a dust cap or cone break-up mode. I seem to recall that some of the XLS drivers did have a rather pronounced break-up mode. Where exactly did you attach the accelerometer? Middle of dust cap? At the dust cap/cone glue joint? Or did you remove the dust cap and get the accelerometer glue as close to the voice coil as possible.
Now I only have the "flat-top" FFT from REW. I have tried the accelerometer on the dust cap, and that gives resonance problems. My mounting can be seen in post 144: (and here)
http://home.ebnett.no/armand/Pics/AccelMount1.JPG
Alternative accelerometer mounting with 4g balance (1 Norwegian krone)
BODE PLOTS and PHASE MARGIN
I have been playing a little with modifications of the filters in my servo circuit and bode plots in excel (while on vacation!) and would like your feedback on my thoughts.
I already have the measured gain and phase of the (DC coupled)amplifier and the speaker. It looks like this:
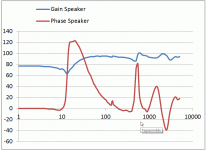
Then I add the response of my servo circuit. A 1,6Hz first order high pass filter at the accelerometer opamp and a 7Hz first order low pass filter on the servo output. The total response then looks like this:
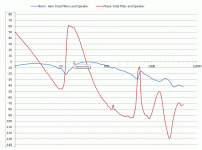
The phase crosses 0 degrees at 4Hz, 13Hz and 36Hz. It will of course be inverted so it is at 180 degrees at these frequencies.
In the picture above we can see that the phase just crosses -90 degrees at about 300Hz and 3000Hz and the output from the filters and woofer combined is respectively about 20 and 40dB lower than at 36Hz. In other words, this should not limit my loopgain. But I am unsure how much gain I can have when the phase is -130 at 2500Hz??? (Or more correct, -130-180= -310 after I have inverted the signal)
I know that if I have gain more than 1 when the phase have turned +-180 degrees the system will oscillate. But how much gain can I have if the phase is say -179? or -130?
Oh, this is my servo circiut.

Best regards
Armand
Sorry to continue the off topic on room gain...If I remember correctly the room gain results were a total of 6 or 7 mic positions (Its been a couple years now) spaced in U shape across the center of the room, all of which are at the headrest where a person would actually sit to watch a movie. No picking and choosing of mic position which would defeat the entire purpose of the exercise. There was also 4 separate subwoofer placements, all the corners. So there is a total of some 30 measurements or so. Also the dip at 13Hz is some resonance effect which I believe to have been out of phase vibration of the floor which would shake notably when excited by sine waves near this range. That is all I could add for the next 4 days as I'm currently hiking and far away from my data back home.
Back to your regularly scheduled MF discussion...
Back to your regularly scheduled MF discussion...
Always nice to see data. Most of us are very shy about publishing the terribly modest outcomes of our projects... if we are honest and not thick skinned enough to survive the inevitable criticism. Your plots are - or might be - very informative kinds of displays.
Is that a square wave you are playing? Or, more likely, you are "squared off" somewhere along the circuit. Not clear what MF can possibly do to such a profoundly confounded event. Analytically speaking and as with OP original posts, this is not an "interesting" case for study because it appears, and please correct me, that the cone or something is bumping into a limit.
The "interesting" case is where you have "normal" distortion and MF reduces it. A spectral analysis, as you have here, highlights lots of driver distortion at ordinary levels and within the useful tone compass of the driver. Granted, you need to show the distortion products on a greatly magnified scale because they are far smaller than the fundamental tone... unlike in your chart... but it is clear when you have distortion and when it is gone.
Also, not possible at this scale of distortion to see what the accelerometer adds (or doesn't add) to the whole.
Moreover, with phase gymnastics of the sort you display, it is not so much a matter of what gain you can demand, as what gain you need to throttle to in order to avoid instability when the phase attacks itself. Alas, that's the world of MF.
Ben
Last edited:
It is true that a speaker in a room is in an other Helmholtz resonator, but observed from the inside. Of course this coujld make a big difference depending if the room is acoustically dead or close, which most aren't.
Hi Armand, thanks for sharing some intell. I am still figuring out why the measured response of the no-FB compared to the FB situation has a difference in magnitude. I can imagine the software tries to determine a certain 0 dB punt, but the deviation from the original plot is very large, even though the voltage output on the terminals is identical. I would expect the software to have a certain fixed 0 dB reference, but it seems that it doesn't.
-I assume that the software is taking it's output voltage as a 0 dB reference. In other words, a cable from lineout to mic-in should read 0 dB. If that is the case, the difference can be distilled to the closed loop gain.
Concerning your bode plot, I think something went wrong there. A typical LS is expected to have an approximated +2 slope from 0 Hz to the first eigenfrequency at sqrt(k/m).
I therefore think you LF results are wrong, since you have a flat magnitude line to 0Hz.
I of course don't know the exact method you used in order to obtain this result, but at first glance, the measurement looks to excite the LF portion too little for a too short amount of time.
To my experience, if math can't accurately determine the FFT at a frequency band, it just runs a flat or does not display it at all. Easiest way to verify is to get your scope and signal generator out and try to verify the LF magnitude and phase
For reference, this is one of the ETFE's, from a setup I am working on. Excited by a logarithmic sweep, starting at something like 1 Hz, up to 10kHz, for a period of time of 60 seconds. Since the sweep is logarithmic, the emphasis is on the LF region exciting the portion of the dynamics sufficiently.
Please note, that the program I use, plots, depending on the full window of dynamics a +180 degrees or -180 degrees phase. A proper resample would show a +180 degree phase in the sub eigenfrequencies of the woofer. Next to that, an ETFE is an Estimate of the transferfunction, but it is a picture I had laying around.
Attachments
Bode Plot question
Hello Armand,
Thanks for posting the information.
Just some questions about the bode plots , on the graphs shown the left vertical axis looks like its the phase but I dont see the gain vertical axis, you cant work out ( I can't work it out) the gain of the loop gain response.
Am I missing something.
Regards
Arthur
Is this a woofer in free air or in an enclosure? Putting the woofer in an enclosure introduces a very dominant "spring" in the dynamics.Concerning your bode plot, I think something went wrong there. A typical LS is expected to have an approximated +2 slope from 0 Hz to the first eigenfrequency at sqrt(k/m).
I therefore think you LF results are wrong, since you have a flat magnitude line to 0Hz.
I just can't figure out what's going on. Why is your sub resonance response flat in gain and 0 degrees? Mass-Spring-Damper systems do not agree with that plot 🙂
http://www.diyaudio.com/forums/atta...controlled-woofer-controller-bode-speaker.gif
Not clear what MF can possibly do to such a profoundly confounded event.
Ben
I had to translate what "profoundly confounded" actually mean. It's always nice to have your vocabulary extended 😀
To my knowledge, this kind of distortion is not at all uncommon at 20Hz with several mm of excursion. Have a look at Mr. Linkwitz's Thor system
Woofer measurements
Regarding my own servosystem I don't want to clutter this thread with my insufficient knowledge of control systems. I have to do some more reading and measurements.
Just to explain my plots:
* The bode plots I posted earlier are probably not correct below 10Hz. I have only measured from 10Hz and up and assumed that phase and gain would not change below that.
* The Y-scale is common for both phase and gain.
* On the second bode plot I have normalized gain at 38Hz to easier see the gain margin.
Armand
Armand -
Feedback systems work only in the range where all the components in the loop are behaving nice. It is however, entertaining and something of an intellectual stimulus to see results outside that range so you and David can keep on posting stuff like that; but not useful for R&D.
Just push your test signals up into a range and down into an amplitude your driver (and maybe amp and maybe sensor) can handle graciously. There will still be ooodles of distortion to be reduced.
The slightly more normal over-drive shown in Linkowitz' charts are way different in scale of distortion than yours with the first harmonic at 4% and declining in an orderly way beyond as they should - unlike yours*.
Ben
*earlier I asked if we were just looking at a FFT of a normal square wave
Last edited:
No, it's not a square wave. The signal is well below the output limits of the amplifier, the sensor has no problems at this level and the voice coil is just inside it's linear range (1" P-P). What we see is how terrible a woofer performs when pushed to its limits.
This is how it is Ben. Believe it.
If you had a look further down on Linkwitz's page you would see that he has massive distortion at 20Hz (like me). My system measures in fact slightly better than Linkwitz's Thor at the same excursion level. (Not that it makes any difference at this level of distortion)
Thor @ 20Hz 1"P-P:
2.order harmonic 18%
3.order harmonic 25%
4.order harmonic 4%
5.order harmonic 10%
6.order harmonic 1,3%
7.order harmonic 1%
My woofer @ 20Hz 1" P-P:
2.order harmonic 7%
3.order harmonic 23%
4.order harmonic 0,8%
5.order harmonic 3%
6.order harmonic 0,14%
7.order harmonic 0,24%
We all agree that these distortion levels are totally outside the limits acceptable in music reproduction.
I have proved (measured with microphone) that it even with my -at best mediocre- MF is possible to take the above distortion level down to:
2.order harmonic 1,6%
3.order harmonic 0,9%
4.order harmonic 0,6%
5.order harmonic 0,4%
6.order harmonic 0,14%
7.order harmonic 0,07%
That is well below the distortion figures of the Thor subwoofer at both 20Hz and 30Hz even when that is at half the excursion.
How is that not useful?
Armand
Sorry for my confusion.
As I now understand it, your charts show effective MF with an accelerometer sensor as measured with a mic. Pending whatever further critical attacks, I'd say you should be counted on the list of folks who made MF work successfully in their systems. But the next step is to show your system has the sensitivity and other abilities to reduce distortion when the amount and occurrence of distortion the woofer is making is in the normal music-listening range.
Now that you've established your tech cred, you are entitled to post subjective interpretive remarks about the sound (so as to tantalizes folks who are thinking of doing it themselves).
Now, we'd all like to see if David's DSP can help advance the application of MF. It would be esp. helpful if David (and anybody else) could move towards some uniformity in how these things are tested, for example, same SLP, same frequencies, etc. Bit of a pipe-dream, but would be helpful.
Footnote: charts and illustrations are always perfectly comprehensible to the guy who posted them. Better to add a text that explains what readers are supposed to see.
Ben
Last edited:
"Now that you've established your tech cred, you are entitled to post subjective interpretive remarks about the sound"
Funny 😉
Funny 😉
Armand, whatever you or David do I'm sure nothing is ever going to satisfy Ben. 🙁
Good work by both of you! 🙂
Good work by both of you! 🙂
Hi,
ohh, I guess, You just need to label it ´non-professional´ or ´Oldtimer-graded´
jauu
Calvin
I know this will qualify for someone kicking my butt. 😉
ohh, I guess, You just need to label it ´non-professional´ or ´Oldtimer-graded´

jauu
Calvin
I know this will qualify for someone kicking my butt. 😉
Last edited:
- Status
- Not open for further replies.
- Home
- Loudspeakers
- Subwoofers
- Low distortion, DSP based high gain servo controlled woofer controller.
