Hornresp Update 3980-160923
Hi Everyone,
CHANGE 1
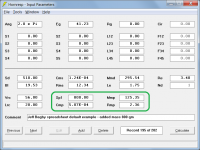
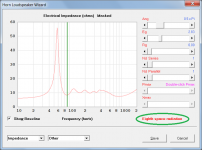
Passive radiators can now be specified. This feature was in effect requested by Mark in Post #6626. See the following sections in the Hornresp Help file for details on how to use the new passive radiator feature:
. Chamber Parameters
. Calculate Parameter
. Chamber Type
. Loudspeaker Wizard
. Direct Radiator in a Closed-Box Enclosure With Passive Radiator
The Hornresp Help Find tool in the File menu can be used to quickly locate 'passive radiator' references.
See Attachments 1, 2 and 3.
CHANGE 2
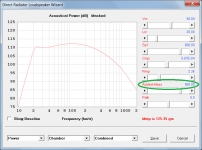
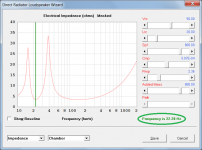
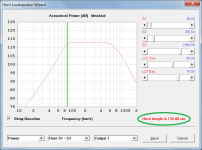
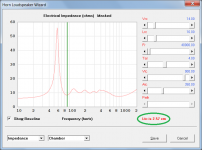
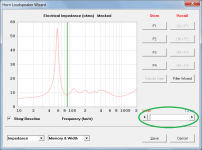
Moving the mouse pointer over the green-coloured principal resonance frequency marker line in the Loudspeaker Wizard tool now shows the frequency value. This feature was requested by Brian in Post #6635. The frequency marker line, previously only available on the Power chart, has now also been added to the Impedance and Displacement charts. See Attachment 3.
CHANGE 3
To overcome further issues arising from fixing the problem reported by just a guy in Post #6656, the Hypex Approximator tool can no longer be used when S2 is greater than 99999.99 sq cm (i.e. when the hyperbolic-exponential horn mouth diameter is greater than 3.56 metres).
Could you please report any bugs you may find.
Kind regards,
David
Hi Everyone,
CHANGE 1
Passive radiators can now be specified. This feature was in effect requested by Mark in Post #6626. See the following sections in the Hornresp Help file for details on how to use the new passive radiator feature:
. Chamber Parameters
. Calculate Parameter
. Chamber Type
. Loudspeaker Wizard
. Direct Radiator in a Closed-Box Enclosure With Passive Radiator
The Hornresp Help Find tool in the File menu can be used to quickly locate 'passive radiator' references.
See Attachments 1, 2 and 3.
CHANGE 2
Moving the mouse pointer over the green-coloured principal resonance frequency marker line in the Loudspeaker Wizard tool now shows the frequency value. This feature was requested by Brian in Post #6635. The frequency marker line, previously only available on the Power chart, has now also been added to the Impedance and Displacement charts. See Attachment 3.
CHANGE 3
To overcome further issues arising from fixing the problem reported by just a guy in Post #6656, the Hypex Approximator tool can no longer be used when S2 is greater than 99999.99 sq cm (i.e. when the hyperbolic-exponential horn mouth diameter is greater than 3.56 metres).
Could you please report any bugs you may find.
Kind regards,
David
Attachments
Such progress in such a short time. Awesome work David!
Suffice to say, I have been working some very late nights / early mornings recently
") .
.Hi David,
Thanks so much for adding the passive radiator functionality!
I'll attach a screen print: to get the green line to show I had to fiddle w/ the pointer until it finally got captured, and the 'Frequency is 22.28 Hz' only appears when the pointer is on the green line. Obviously workable. I would prefer to see the frequency read-out all the time.
Thanks again,
Regards,
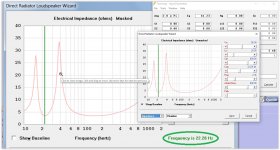
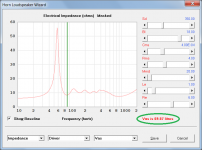
P.S.: On the visibility of the diagram lines: still no progress here. I'm attaching a screen print showing your example form Post #6663 (impedance), and my attempt at duplicating your 'Jeff Bagby spreadsheet default example'. Even my grandson cannot see the lines. I'm blaming it on the latest greatest Windows 10 upgrades, as something has definitely changed in my computer display; but, who knows?
Thanks so much for adding the passive radiator functionality!
I'll attach a screen print: to get the green line to show I had to fiddle w/ the pointer until it finally got captured, and the 'Frequency is 22.28 Hz' only appears when the pointer is on the green line. Obviously workable. I would prefer to see the frequency read-out all the time.
Thanks again,
Regards,
P.S.: On the visibility of the diagram lines: still no progress here. I'm attaching a screen print showing your example form Post #6663 (impedance), and my attempt at duplicating your 'Jeff Bagby spreadsheet default example'. Even my grandson cannot see the lines. I'm blaming it on the latest greatest Windows 10 upgrades, as something has definitely changed in my computer display; but, who knows?
Attachments
Hi BP1Fanatic,
Thanks, but that only affects the display of the baseline while displaying a newly calculated line. My problem is that I do not get any vertical and horizontal graph lines.
Regards,
You don't see the grid???? I can see it in your screen shot!
Hi nc535,
I have asked a number of people to look at my laptop computer screen, and they cannot see the lines either. Neither on newly generated graphs, nor on David's example graphs from Post #6663, nor on the screen print I posted in Post #6668. Quite strange. I'll have to find a different computer to try this on.
Regards,
Hi nc535,
I have asked a number of people to look at my laptop computer screen, and they cannot see the lines either. Neither on newly generated graphs, nor on David's example graphs from Post #6663, nor on the screen print I posted in Post #6668. Quite strange. I'll have to find a different computer to try this on.
Regards,
This site might come in handy
- LCD monitor test imagesHi GM,
Interesting. Could you please let me know if "freezing" still occurs with the latest release.
So far, no problems with 160907.
GM
I'm blaming it on the latest greatest Windows 10 upgrades, as something has definitely changed in my computer display; but, who knows?
Works for me as I've no problems with 160907 release on win 7 pro/HP workbook and just acquired used win 10/cheap Dell LT.
GM
Strange indeed. But the lines are in the image. Perhaps too faint. You could try configuring successively lower resolutions until,they show up. Also go to display propertiesthen advanced display properties and see if any of,the eptione there help,Hi nc535,
I have asked a number of people to look at my laptop computer screen, and they cannot see the lines either. Neither on newly generated graphs, nor on David's example graphs from Post #6663, nor on the screen print I posted in Post #6668. Quite strange. I'll have to find a different computer to try this on.
Regards,
The gridlines are clearly visible in the screenshot.
Playing around with the settings on my PC video card the one that made the grid lines disappear was the contrast setting. The contrast setting on my PC has a range from 0 to 200. Moving the slider from the default setting of 100 to 158 was enough to make the grid lines totally disappear on my display.
Playing around with the settings on my PC video card the one that made the grid lines disappear was the contrast setting. The contrast setting on my PC has a range from 0 to 200. Moving the slider from the default setting of 100 to 158 was enough to make the grid lines totally disappear on my display.
I would prefer to see the frequency read-out all the time.
Hi Oliver,
The frequency read-out shares the same location as several other context-sensitive status messages and one horizontal scroll bar, which is why it is not permanently displayed. It is important to me that the Hornresp forms do not become too cluttered - I like things to be "neat and tidy".
Yet another example of Hornresp "multi-tasking"
.Kind regards,
David
Attachments
So far, no problems with 160907.
Thanks GM.
Hopefully 3980-160923 will work okay for you as well.
- Home
- Loudspeakers
- Subwoofers
- Hornresp