Not sure why my unadjusted sim is slightly different than LTD's but whatever, I used his published Hornresp inputs exactly.
Any difference could be due to an incorrectly-calculated path length for the horn. Based on quite a few designs I've seen around, I suspect that particular problem is pretty common. To confirm, just look at the measured Fb for the build and compare it to the simulated Fb. If it's off, then the path length needs to be adjusted. Somewhat easy to do with a horn with one flare rate. If there's more than one flare rate, then some guesstimation is required
") .
.I agree with your comments wrt Josh and his measurements. I suspect however that he'd agree too that other independent measurements need to be considered before developing an observation into a method of procedure for design purposes
I can't speak for Ricci but I don't think he doubts the validity of his own measurements at all. But ideally yes more data is better than less. But in lieu of any other way to get even reasonable sim results with this type of driver you can take the adjustment method or leave it. Not sure what else I can do. From you comments it seems clear you haven't read the paper but if you did you would see the 50 examples and could better come to an opinion of the method's validity. IMO I certainly wouldn't design an enclosure for this type of driver WITHOUT using this adjustment. Josh did mention that he had his own method for getting a more accurate sim for this type of driver that was similar to what I was doing but he didn't say exactly what it was.
Josh mentions on this site that there are two other public repositories of measurements done to CEA-2010 standards.
I haven't seen that. if they include drivers of this type I'm interested, if not it's completely useless to me. At the very least they would have to have at one driver of the same model measured, and even then unless they measured the exact same driver under the same conditions with the same equipment, the repositories would only serve as a larger data pool but would be pretty useless to confirm data-bass measurements.
Does the B&C 18TBX100 qualify as a "large-coil" subwoofer?
I'm going to stop just short of saying absolutely not. It doesn't have higher than average excursion capabilities and the measurements of the 21sw do not exhibit an inductance hump or falling response at high frequencies. Since the 21sw coil is much larger than the 18tbx I don't think there's any chance that the 18 would have this problem.
Last edited:
Any difference could be due to an incorrectly-calculated path length for the horn. Based on quite a few designs I've seen around, I suspect that particular problem is pretty common. To confirm, just look at the measured Fb for the build and compare it to the simulated Fb. If it's off, then the path length needs to be adjusted. Somewhat easy to do with a horn with one flare rate. If there's more than one flare rate, then some guesstimation is required
It's beyond the scope of the study to ensure the horn was properly folded. LTD did it and I'm pretty sure it's gppd enough but I'm fine if you completely disregard this one example. All the other designs (including tapped horns) were done by Ricci, and I'm pretty sure he knows what he's doing. He's gone into detail about designing the Othorn.
To be honest, I think the difference between his sim and mine was probably just that he used published t/s and I used Ricci's measured t/s. IIRC that's what happened but it was several months ago now. I do know I used his exact horn dimensions inputs though. The difference between the sim I did and the sim he showed in the measurement pic is not large but it's clearly noticeable so I thought I'd mention it.
Last edited:
From you comments it seems clear you haven't read the paper but if you did you would see the 50 examples and could better come to an opinion of the method's validity.
Actually I did have a look at your paper some time ago JAG. From what I remember, it's based a lot on measured data and doesn't really go into a lot of theory-based explanation as to *why* such a difference would be observed with large voice coil drivers as opposed to "normal" ones. As its conclusions are based on the main part on measurements to reach an empirical conclusion that's equivalent to an engineer's "curve-fit", I think its position would have been strengthened by the use of measurements from more than one source.
Since the 21sw coil is much larger than the 18tbx I don't think there's any chance that the 18 would have this problem.
Good, since my last build involved one of those drivers and it came out just about as I expected from the HornResp sim (once the leaks were fixed)
To be honest, I think the difference between his sim and mine was probably just that he used published t/s and I used Ricci's measured t/s.
Fb is based purely on the horn's geometry and has no relation to the driver's t/s, measured or otherwise. That's why I believe checking Fb and confirming a match with the sim is one good way to check to see if the sim's a decent one.
Actually I did have a look at your paper some time ago JAG. From what I remember, it's based a lot on measured data and doesn't really go into a lot of theory-based explanation as to *why* such a difference would be observed with large voice coil drivers as opposed to "normal" ones. As its conclusions are based on the main part on measurements to reach an empirical conclusion that's equivalent to an engineer's "curve-fit", I think its position would have been strengthened by the use of measurements from more than one source.
Yes, empirical curve fit is exactly what it is.
The paper didn't go into the theory because I don't know exactly why some drivers are affected but others are not. For example the Dayton HO has very low normalized inductance and only moderate excursion and power handling capability but it has a problem. The 21sw has a massive coil diameter but it doesn't have an inductance hump or falling high frequencies in the measurements. I could speculate on what I think the differences might be but I'm not a driver designer and have no details of either driver's coils or motors so I don't think speculation would be appropriate.
Once again I agree that more data would be better than less but there's not much I can do about that. This type of driver isn't all that popular anywhere except avs forum and in car audio, and those crowds are not particularly well know for doing high quality measurements outdoors. if you have links of high quality measurements send them to me and when I have time I will incorporate the results into my study.
Fb is based purely on the horn's geometry and has no relation to the driver's t/s, measured or otherwise. That's why I believe checking Fb and confirming a match with the sim is one good way to check to see if the sim's a decent one.
The low knee is pretty similar in both unadjusted sims, it looks to be within 1 hz anyway. it's just that mine had a bit of a bump at the low knee, his did not - the q of the bump at the low knee will change the apparent frequency of the low knee by a bit. And other very small very subtle differences which are probably just due to using different t/s (published vs Ricci's measured). The BIG difference is between the adjusted sim vs both of the unadjusted sims. The low knee drops quite a bit in the adjusted sim and better matches the measurement. (The lower low knee is a flh phenomenon that happens if you raise qts in the same way that the sealed box "inductance hump" is just a high q bump indicating a too small box - tapped horns behave differently than flh when you raise qts). Take any flh sim, raise the driver qts and the low knee will drop in frequency.
Anyway, I really do appreciate your input and I agree. If I had more data to use I would have used it. The problem is there is not that much RELIABLE data out there. It seems like people that use this type of driver are not into measuring much. Plenty of in room measurements but not the type of measurements Ricci does. Even if there was a lot of data it would be hard to determine what was accurate and reliable. If it came from Red Rock or other pro measurement sources it would be safely reliable but anything short of that level of professionalism (or Ricci's) would just add more uncertainty to the mix. I understand the desire for verifiable results and I share that desire but there's really nothing I can do but trust Ricci's measurements. I chose his measurements for a reason after all.
Last edited:
Just tried hornresp on several WIN10 machines (all up to date with all updates etc..), both 32 und 64 bit, AMD and Intel CPUs.... Works every time like it used to..
Thanks Sabbelbacke, for checking this.
For these reasons it was decided that the Large Voice Coil results should be confined to the Loudspeaker Wizard, since allowing it in the main section of the program would bring up questions about the validity of the extra data that the extra graphs provide.
Thanks just a guy, for explaining the reasons for the decision.
Enhancement request #1: A vertical line on the Loudspeaker Wizard: Power Response chart that shows where Fb (the lowest resonance frequency) is.
It's not going to happen
.Enhancement request #2: An option to display the vertical axis for the Loudspeaker Wizard: Power Response chart in 3dB (or 6dB) rather than 5dB steps.
Ditto
.Enhancement request #1: A vertical line on the Loudspeaker Wizard: Power Response chart that shows where Fb (the lowest resonance frequency) is.
Enhancement request #2: An option to display the vertical axis for the Loudspeaker Wizard: Power Response chart in 3dB (or 6dB) rather than 5dB steps.
Hi Brian,
Further to my post #5949, the reason why I am reluctant to include your suggested enhancement #1 in the Loudspeaker Wizard is that it would be necessary to first calculate the impedance chart results in order to identify the lowest resonance frequency before then calculating and displaying the Power Response chart with the frequency marker line shown. Unfortunately this would slow the Wizard "update" time quite significantly, and could lead to sliders "freezing" / "locking-up" in some cases, which I want to avoid happening if at all possible.
Incidentally, you refer to "Fb" as the lowest resonance frequency, which is a pretty wide interpretation. Strictly speaking, fB is defined as the Helmholtz resonance frequency of a vented box. (The resonance frequency of a closed-box system is defined as fC).
With regard to your suggested enhancement #2, I have had a change of heart and will include the feature in the next update. It will be possible to specify either 3dB, 6dB or 5dB (default) increments for SPL in the Loudspeaker Wizard, and on the main chart.
One enhancement request out of two is not a bad strike rate - congratulations
.Kind regards,
David
Hi Brian,
Further to my post #5949, the reason why I am reluctant to include your suggested enhancement #1 in the Loudspeaker Wizard is that it would be necessary to first calculate the impedance chart results in order to identify the lowest resonance frequency before then calculating and displaying the Power Response chart with the frequency marker line shown. Unfortunately this would slow the Wizard "update" time quite significantly, and could lead to sliders "freezing" / "locking-up" in some cases, which I want to avoid happening if at all possible.
Incidentally, you refer to "Fb" as the lowest resonance frequency, which is a pretty wide interpretation. Strictly speaking, fB is defined as the Helmholtz resonance frequency of a vented box. (The resonance frequency of a closed-box system is defined as fC).
With regard to your suggested enhancement #2, I have had a change of heart and will include the feature in the next update. It will be possible to specify either 3dB, 6dB or 5dB (default) increments for SPL in the Loudspeaker Wizard, and on the main chart.
One enhancement request out of two is not a bad strike rate - congratulations
Kind regards,
David
Cool, thanks. I think the ability to adjust the dB scale like that is really going to come in handy.
On the "Fb" thing, I was using the term to address the lower resonance frequency of any alignment produced in HornResp (I don't think that there's an official all-encompassing term for that, at least as far as I know). That's usually the point below which the driver's excursion starts to increase substantially and represents a sort of "danger zone" for high-power applications, and no boosting by EQ should be done in that zone for obvious reasons. I can see how it would be a bit of a pain in the **** to ascertain though in a real-time tool like the LW without affecting its performance.
Personally I shy away from the term Fb, I either use the term Tuning Frequency or Low Knee depending on what I am describing. I'm not sure if Tuning Frequency is always (or ever) the same as Fb, I haven't looked into it and don't really care since the terms I prefer to use are clear enough.
Tuning Frequency (IMO) is simply the lowest frequency with the lowest point of minimum excursion, just look at the displacement graph and Tuning is the lowest frequency excursion dip. It's near 30 hz in both the flh and tapped horn examples below. (The red line in the graph is where excursion starts to exceed the first excursion bump above tuning, this is always a few hz below tuning frequency.)
I'm not sure how hard it would be for the program to look for this lowest frequency excursion dip BUT if this were to become a feature I would hope it would be defeatable, I don't like red lines on my graphs. AND if it it was defeatable, for the people that did desire to see this red line on the graph, I expect they would not mind having lags in processing time associated with having the feature turned on, and it obviously wouldn't have any time lag if the feature was not turned on.
Tuning Frequency (IMO) is simply the lowest frequency with the lowest point of minimum excursion, just look at the displacement graph and Tuning is the lowest frequency excursion dip. It's near 30 hz in both the flh and tapped horn examples below. (The red line in the graph is where excursion starts to exceed the first excursion bump above tuning, this is always a few hz below tuning frequency.)
An externally hosted image should be here but it was not working when we last tested it.
I'm not sure how hard it would be for the program to look for this lowest frequency excursion dip BUT if this were to become a feature I would hope it would be defeatable, I don't like red lines on my graphs. AND if it it was defeatable, for the people that did desire to see this red line on the graph, I expect they would not mind having lags in processing time associated with having the feature turned on, and it obviously wouldn't have any time lag if the feature was not turned on.
Not sure if this has been asked before, but is there any way to get at least basic active high pass filter functionality into the main program (before hitting Calculate)?
IMO (even though I have been guilty of not doing this) designs should always and only be compared with the required hpf in place. Different enclosure types have different responses to required hpfs (for example flhs can lose 2 - 4 db more in the lowest frequencies than ported boxes or tapped horns due to the required hpf). Also, it would be really nice to use other tools including but not limited to viewing port velocity with hpf in place, which is a requirement if you want to design for the smallest ports possible.
IMO (even though I have been guilty of not doing this) designs should always and only be compared with the required hpf in place. Different enclosure types have different responses to required hpfs (for example flhs can lose 2 - 4 db more in the lowest frequencies than ported boxes or tapped horns due to the required hpf). Also, it would be really nice to use other tools including but not limited to viewing port velocity with hpf in place, which is a requirement if you want to design for the smallest ports possible.
Not sure if this has been asked before, but is there any way to get at least basic active high pass filter functionality into the main program (before hitting Calculate)?
Hi just a guy,
The way that Hornresp has evolved, it would require a lot of work to do this, unfortunately.
It's highly unlikely - but I am fast learning never to say never, just in case...
Kind regards,
David
I expect they would not mind having lags in processing time associated with having the feature turned on,
They wouldn't like it much though when the Wizard sliders freeze up completely forcing them to close everything down and start again, which could happen
.if someone has a working copy of the LeCleach horn spreadsheet which I would be very, very interested to get.
Hi Hajo,
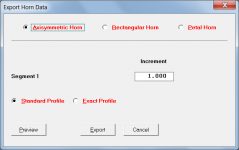
If all you want to do is to calculate the "construction" dimensions of a given Le Cléac'h horn, then Hornresp can do this for you without the need for a copy of Jean-Michel's spreadsheet. Simply select File > Export > Horn Data from the Schematic Diagram window.
Kind regards,
David
Attachments
But I use Hornresp when I am calculating them. Easier and just as accurate.
Hi Mark,
For axisymmetric Le Cléac'h horns, the Hornresp "Exact Profile" option exactly matches the theoretical ideal. The "Standard Profile" option gives an identical result to Jean-Michel's 2007 spreadsheet (which is a close approximation to the perfect profile, but not precisely the same).
See the following post for further details.
http://www.diyaudio.com/forums/multi-way/140190-jean-michel-lecleach-horns-114.html#post2619419
Kind regards,
David
- Home
- Loudspeakers
- Subwoofers
- Hornresp