I'm not sure how hard it would be for the program to look for this lowest frequency excursion dip
Hi just a guy,
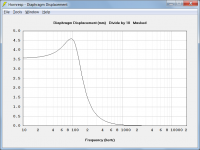
It should not be too difficult to come up with an algorithm for the two examples you show, but diaphragm displacement curves similar to the attached could present a problem. Perhaps in such cases no attempt should be made to include a resonance frequency marker line, even though the loudspeaker system itself has a clearly defined low frequency rolloff corner in the power response.
I would appreciate any thoughts / suggestions you may have on this matter.
Kind regards,
David
Attachments
David, - many thanks for the hint. But I am still interested in the "later" Excel speadsheet - Hajo
Hi Hajo,
If all you want to do is to calculate the "construction" dimensions of a given Le Cléac'h horn, then Hornresp can do this for you without the need for a copy of Jean-Michel's spreadsheet. Simply select File > Export > Horn Data from the Schematic Diagram window.
Kind regards,
David
Hi just a guy,
It should not be too difficult to come up with an algorithm for the two examples you show, but diaphragm displacement curves similar to the attached could present a problem. Perhaps in such cases no attempt should be made to include a resonance frequency marker line, even though the loudspeaker system itself has a clearly defined low frequency rolloff corner in the power response.
I would appreciate any thoughts / suggestions you may have on this matter.
Kind regards,
David
I'm sorry, I have nothing for you. I'm not sure how this feature should react to a situation like this or even how it would be useful. As I understand it, this feature was supposed to determine at what point the excursion skyrockets (or more accurately since it calculates the tuning frequency the excursion would skyrocket a bit below this point) in a design that uses strong resonant output, and this really isn't useful information in a design like the one shown here. In this situation it's probably likely that no hpf would be used and the volume knob would be used to keep this design within xmax (unless it's a midrange driver in which case the desired crossover point would be the determining factor for the hpf frequency, not the frequency where excursion starts to rise dramatically).
I'm personally not that excited about this feature anyway, it's not something I would use as I hinted when I said I would hope it would be a defeatable feature since I don't like red lines on my graphs unless I choose to put them there. I was just trying to be helpful in the event that you did want to include this feature by pointing out that it might be easier to program to find the dip indicating the tuning frequency (since this information is generated automatically on the excursion screen with no time lag in the Wizard) instead of whatever other method might be used to find "Fb" or whatever it's called in boxes other than ported like flh and tapped horn. It sounded like you were opposed to this feature due to logistics, I was just trying to help with that. Since I don't know how you were planning to do it in the first place and I don't know if finding the dip would be easier than what you had planned, I'm not even sure if my suggestion was useful in any way.
For sealed designs or anything else that does not have a clear and distinct dip in response indicating a tuning frequency (like overstuffed ported boxes or similar situations that damp the impedance peaks) I don't think it's at all useful to point out "Fc", "Fb" or the frequency of the impedance peak(s).
Maybe Brian can be more helpful since he has a clear vision of what he wants this feature to do.
Last edited:
post5961Hi just a guy,
It should not be too difficult to come up with an algorithm for the two examples you show, but diaphragm displacement curves similar to the attached could present a problem. Perhaps in such cases no attempt should be made to include a resonance frequency marker line, even though the loudspeaker system itself has a clearly defined low frequency rolloff corner in the power response.
I would appreciate any thoughts / suggestions you may have on this matter.
Kind regards,
David
What does the "Divide by 10" mean?
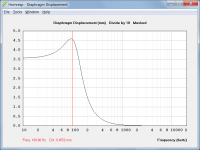
Does it mean that the excursion is 0.45mm (4.5mm/10) @ 100Hz for the Eq in the data input dialog box?
Does it mean that the excursion is 0.45mm (4.5mm/10) @ 100Hz for the Eg in the data input dialog box?
Hi Andrew,
Yes.
It can be readily confirmed using the Sample tool - see attached.
Kind regards,
David
Attachments
Nice that Hornresp can give you a sliding upper limit on the spl readings now.
Hi Mark,
The SPL chart upper limit has always been "sliding". The maximum possible value is 995 dB
") .
.Kind regards,
David
David, - many thanks for the hint. But I am still interested in the "later" Excel speadsheet - Hajo
Hi Hajo,
Perhaps Mark would be prepared to send you a copy:
I have the spreadsheet.
Kind regards,
David
I'm sorry, I have nothing for you. I'm not sure how this feature should react to a situation like this or even how it would be useful. As I understand it, this feature was supposed to determine at what point the excursion skyrockets (or more accurately since it calculates the tuning frequency the excursion would skyrocket a bit below this point) in a design that uses strong resonant output, and this really isn't useful information in a design like the one shown here. In this situation it's probably likely that no hpf would be used and the volume knob would be used to keep this design within xmax (unless it's a midrange driver in which case the desired crossover point would be the determining factor for the hpf frequency, not the frequency where excursion starts to rise dramatically).
I'm personally not that excited about this feature anyway, it's not something I would use as I hinted when I said I would hope it would be a defeatable feature since I don't like red lines on my graphs unless I choose to put them there. I was just trying to be helpful in the event that you did want to include this feature by pointing out that it might be easier to program to find the dip indicating the tuning frequency (since this information is generated automatically on the excursion screen with no time lag in the Wizard) instead of whatever other method might be used to find "Fb" or whatever it's called in boxes other than ported like flh and tapped horn. It sounded like you were opposed to this feature due to logistics, I was just trying to help with that. Since I don't know how you were planning to do it in the first place and I don't know if finding the dip would be easier than what you had planned, I'm not even sure if my suggestion was useful in any way.
For sealed designs or anything else that does not have a clear and distinct dip in response indicating a tuning frequency (like overstuffed ported boxes or similar situations that damp the impedance peaks) I don't think it's at all useful to point out "Fc", "Fb" or the frequency of the impedance peak(s).
Maybe Brian can be more helpful since he has a clear vision of what he wants this feature to do.
Hi just a guy,
Thanks for your comments. I will wait to see if Brian has anything further to say.
Kind regards,
David
I just did some work simulating a system that will require 160 db at 1 meter.
Are you working on some sonic cannons like in The Incredible Hulk movie?
Shaktronics Sonic Cannons Coming To A Riot Near You
Last edited:
Are you working on some sonic cannons like in The Incredible Hulk movie?
Shaktronics Sonic Cannons Coming To A Riot Near You
Nope. Rocket launch simulation. Very high SPL. Extremely wide bandwidth.
Fun job.
Hi Hajo,
Perhaps Mark would be prepared to send you a copy:
Kind regards,
David
A copy will be sent out when I get back home. Spemding some unplanned time in an airport tonight and quite a bit of tomorrow.
Gotta love air travel.
When it works!
Nope. Rocket launch simulation. Very high SPL. Extremely wide bandwidth.
Fun job.
I bet it is! I went to USC in 2013 and saw the space shuttle movie in their imax theater. THAT was fun!
It should not be too difficult to come up with an algorithm for the two examples you show, but diaphragm displacement curves similar to the attached could present a problem. Perhaps in such cases no attempt should be made to include a resonance frequency marker line, even though the loudspeaker system itself has a clearly defined low frequency rolloff corner in the power response.
Agreed. My concern is to really to show on the power response graph where the driver starts to get unloaded, so This would be applicable only to those alignments where there isn't a sealed chamber behind (or in front of) the driver. I suggested a line, but another method could be used to signify this point, e.g. using a different color for the graph below the "tuning frequency", or a highlighted point on the graph itself.
Agreed. My concern is to really to show on the power response graph where the driver starts to get unloaded, so This would be applicable only to those alignments where there isn't a sealed chamber behind (or in front of) the driver.
FLHs can and often do have a dramatic rise in excursion that could be called "skyrocketing" or "unloading" as well. The sealed chamber keeps that somewhat in check, but the excursion peak below tuning is often 2x or much more than the first excursion peak above tuning. A high pass filter is often used to control that peak. I would think that any design that has clear resonant output shown by one or more severe dips in excursion should not be eliminated from this feature IF it is implemented. To exclude FLHs would be to say they have no excursion issue below tuning similar to vented or tapped horns, no? They clearly do though, not quite as bad but excursion does skyrocket below tuning.
Besides, marking the tuning frequency is not showing the point where excursion is an actual problem, the real unloading happens a few hz below tuning. I'm not saying it's a bad thing to know where the tuning frequency is, but the excursion graph shows where it is AND the frequency below tuning where excursion starts to be an actual problem.
I suggested a line, but another method could be used to signify this point, e.g. using a different color for the graph below the "tuning frequency", or a highlighted point on the graph itself.
I still vote for the feature to be completely defeatable. Mark it with a red line, a different color, a highlighted point or whatever you like, but I'd like to be able to turn it off completely (maybe with a checkbox). I get excursion info from the excursion graph which is just a click away and gives much more relevant info than marking the tuning point on a frequency response graph. To be clear, I'm not voting against the feature itself, just that it should be possible to turn it off.
Last edited:
A copy will be sent out when I get back home.
Thanks Mark.
Agreed. My concern is to really to show on the power response graph where the driver starts to get unloaded, so This would be applicable only to those alignments where there isn't a sealed chamber behind (or in front of) the driver. I suggested a line, but another method could be used to signify this point, e.g. using a different color for the graph below the "tuning frequency", or a highlighted point on the graph itself.
Hi Brian,
To avoid the previously mentioned potential slider "lock-up" problems, it may be necessary to limit the diaphragm displacement algorithm to only looking for resonances below 100Hz. Would this be sufficient for your purposes?
If the feature was to be implemented, the lowest resonance frequency point detected below 100Hz would be indicated by a vertical marker line. If no resonance was found below 100Hz then no line would be shown.
Kind regards,
David
To be clear, I'm not voting against the feature itself, just that it should be possible to turn it off.
Hi just a guy,
If implemented, the feature would be activated by double-clicking anywhere on the Power chart. It would be deactivated by pressing the Esc key from the Power chart.
Kind regards,
David
Not sure if this has been asked before, but is there any way to get at least basic active high pass filter functionality into the main program (before hitting Calculate)?
Also, it would be really nice to use other tools including but not limited to viewing port velocity with hpf in place, which is a requirement if you want to design for the smallest ports possible.
Hi just a guy,
If all goes according to plan, the requested feature will be in the next release. It will apply to all charts except for Maximum SPL, and for those generated when Eg = 0 (constant diaphragm velocity). It will be possible to specify either an active high pass, an active low pass, or an active band pass filter prior to calculating the main results. The specified filter settings will be saved as part of the permanent record.
Kind regards,
David
- Home
- Loudspeakers
- Subwoofers
- Hornresp