The flag is there! Man, talk about fast response!
No not yet... It was just a question ...

Breez, try the New version with Bug fixes 1.4.0.6
It works correctly now, thank you.
New version with improvements 1.4.0.8
Version 1.4.0.8 (2009-10-06)
Features/Changes:
* Improved logarithmic frequency axis
* Improved Time-zero Auto detect methods
* Measurement > Options > Info button
* Measurements data extra field: Application info
* Measurements data extra field: Date
* Windows Vista GUI compatible record-meter
* Exporting phase - Phase extend -> Phase Unwrap (Same functionality)
Bugfixes:
* Crash when closing application
Would it be possible to add an option to show group delay instead of phase?
Little easier to see as it does not wrap around, just adds time.
Possibly with distance as an option for scale.
When I try to calibrate with loopback it only calibrates the parts that are within -3dB. A little annoying when the response rolls of smoothly and it just need to correct a little phase and level at the low end.
Can it be made to calibrate a broader range?
Would it be possible to add an option to show group delay instead of phase?
That would be a very nice feature.

Found a bug.
The rectangle that you use to zoom in to a graph eats up 100% CPU when moved around. It also moves a tremendous amount of data though memory. (memory usage goes up and down very fast, looks like "noise" when graphed. It also keeps the memory usage some time (depends) before it is dumped after a while, which is also little random.
I have not looked into it that deep.
Found a bug.
The rectangle that you use to zoom in to a graph eats up 100% CPU when moved around. It also moves a tremendous amount of data though memory. (memory usage goes up and down very fast, looks like "noise" when graphed. It also keeps the memory usage some time (depends) before it is dumped after a while, which is also little random.
I have not looked into it that deep.
Try grabbing your browser and moving it similarly.
Found a bug.
The rectangle that you use to zoom in to a graph eats up 100% CPU when moved around. It also moves a tremendous amount of data though memory. (memory usage goes up and down very fast, looks like "noise" when graphed. It also keeps the memory usage some time (depends) before it is dumped after a while, which is also little random.
I have not looked into it that deep.
You mean the adjustable rectangle for zooming?
I have tried all zooming possibilities while checking CPU activity and didn't notice anything strange...
You are right!
Thanks
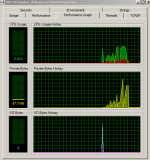
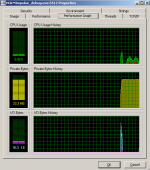
You are right about the memory usage. Below shows memory usage up to 400 MB when moving the rectangle around - The memory usage drops afterwards - The .Net garbage collecter works - and I don't have any referenced objects.
So It's not a real bug ;-)
The other memory profile shows usage after I improved the code.
(It will be there in next version
Bad code:
DrawImage(Drawing::TextureBrush(bitmap).Image,0,0);
//Each time a TextureBrush object is created
Improved code:
DrawImage(bitmap,0,0);
Found a bug.
The rectangle that you use to zoom in to a graph eats up 100% CPU when moved around. It also moves a tremendous amount of data though memory. (memory usage goes up and down very fast, looks like "noise" when graphed. It also keeps the memory usage some time (depends) before it is dumped after a while, which is also little random.
I have not looked into it that deep.
Thanks
You are right about the memory usage. Below shows memory usage up to 400 MB when moving the rectangle around - The memory usage drops afterwards - The .Net garbage collecter works - and I don't have any referenced objects.
So It's not a real bug ;-)
The other memory profile shows usage after I improved the code.
(It will be there in next version
Bad code:
DrawImage(Drawing::TextureBrush(bitmap).Image,0,0);
//Each time a TextureBrush object is created
Improved code:
DrawImage(bitmap,0,0);
Attachments
+1Would it be possible to add an option to show group delay instead of phase?
askbojesen, thank you for your work!
Seconded!+1
askbojesen, thank you for your work!
Only that I'm now out of spare time to use the SW extensively since I got a new job, full-time.. in the audio business, which is ironic...

- Klaus
Seconded!
Only that I'm now out of spare time to use the SW extensively since I got a new job, full-time.. in the audio business, which is ironic...
- Klaus
I can only reiterate again how pleased I too am with this software. It is very stable and works well. The ability to dump a complete polar map in a single file is a blessing beyond words.
Only one thing - impedance. I get very clean impedance curves from the voltage and current impulse responses, but since the complex division must be done off line this is not so convenient. A simple "divide two spectrum" would be Oh-so-nice!!
I'll second that. Even though I haven't gotten into building and testing yet I love having this around to test various things I am curious about.
If there was one thing I would want for a feature is the ability to load a VST plugin directly into the software for testing out filters but this is a rather selfish request. Maybe the ability to use different I/Os from my soundcard which has 8analog I/Os and Spidf on 9 and 10. Neither of those are that big of a deal though.
If there was one thing I would want for a feature is the ability to load a VST plugin directly into the software for testing out filters but this is a rather selfish request. Maybe the ability to use different I/Os from my soundcard which has 8analog I/Os and Spidf on 9 and 10. Neither of those are that big of a deal though.
Som minor bugfixes and features
Version 1.4.1.0 (2009-10-08)
Features/Changes:
* User Guide integration: Help > User Guide
* Total response improved to confirm with ANSI+ISO 1/3, 1/6 octave filters
Bugfixes:
* Huge memory usage when drawing graphs
* Plotting harmonic distortion when not available causes unhandled exception
Version 1.4.1.0 (2009-10-08)
Features/Changes:
* User Guide integration: Help > User Guide
* Total response improved to confirm with ANSI+ISO 1/3, 1/6 octave filters
Bugfixes:
* Huge memory usage when drawing graphs
* Plotting harmonic distortion when not available causes unhandled exception
Divide two spectrum
I think, that we already have this feature
I have started a user Guide (Version 0.0.4) so very incomplete at the moment.
Try to see the User Guide chapter: Manipulation
get the user guide from
http://holmacoustics.com/holmimpulse.php
Or install the latest update and go to Help > 'User Guide (Checks for update)'
I would like to see one of your impedance measurements in HOMImpulse
Only one thing - impedance. I get very clean impedance curves from the voltage and current impulse responses, but since the complex division must be done off line this is not so convenient. A simple "divide two spectrum" would be Oh-so-nice!!
I think, that we already have this feature
I have started a user Guide (Version 0.0.4) so very incomplete at the moment.
Try to see the User Guide chapter: Manipulation
get the user guide from
http://holmacoustics.com/holmimpulse.php
Or install the latest update and go to Help > 'User Guide (Checks for update)'
I would like to see one of your impedance measurements in HOMImpulse
Last edited:
Multiple export
I guess your working strategy is:
1. Measure different angles in slots 0,...,N
2. Export all the IRs
3. Import the IRs to MatLab or other such tool
4. Transform to frequency domain in the tool
5. Visualize
- I could easily export the 0,...,N measurements as FRs?
- I could plot all 0,...,N FRs in one graph? - but what about colors and identifying...
The ability to dump a complete polar map in a single file is a blessing beyond words.
I guess your working strategy is:
1. Measure different angles in slots 0,...,N
2. Export all the IRs
3. Import the IRs to MatLab or other such tool
4. Transform to frequency domain in the tool
5. Visualize
- I could easily export the 0,...,N measurements as FRs?
- I could plot all 0,...,N FRs in one graph? - but what about colors and identifying...
Ask
Yes, thats the idea. In many ways what you suggest would be excellent. I do 13 curves but I can only see 3 at a time. More would be better. Sure it makes snese to export the FR's as well, but I do things with the impulse response so I need this raw data as well.
I am still in version 1.3 as I recall - could this divide two FR's? As complex numbers of course.
What I find most useful is a color contour map as in http://www.gedlee.com/summa_.htm. This kind of plot should be the standard as it is hard to cheat and shows all the linear data that needs to be shown. Of course the standard axial FR is far from the whole story. My plots use a commercial package of course, but they aren't really that hard to generate. Level as colors in small blocks is quite easy.
I am still in version 1.3 as I recall - could this divide two FR's? As complex numbers of course.
I think so, but has been a lot of bug-fixes and improvements since 1.3 - so I suggest you upgrade
- Home
- Design & Build
- Software Tools
- HOLMImpulse: Measuring Frequency & Impulse Response